- If PRs created themselves are low, you would want to further diagnose and analyze Maker time, Coding days, Involvement, Quiet days, Issues without PRs, and Lines of code metrics for John to gauge what’s going wrong.
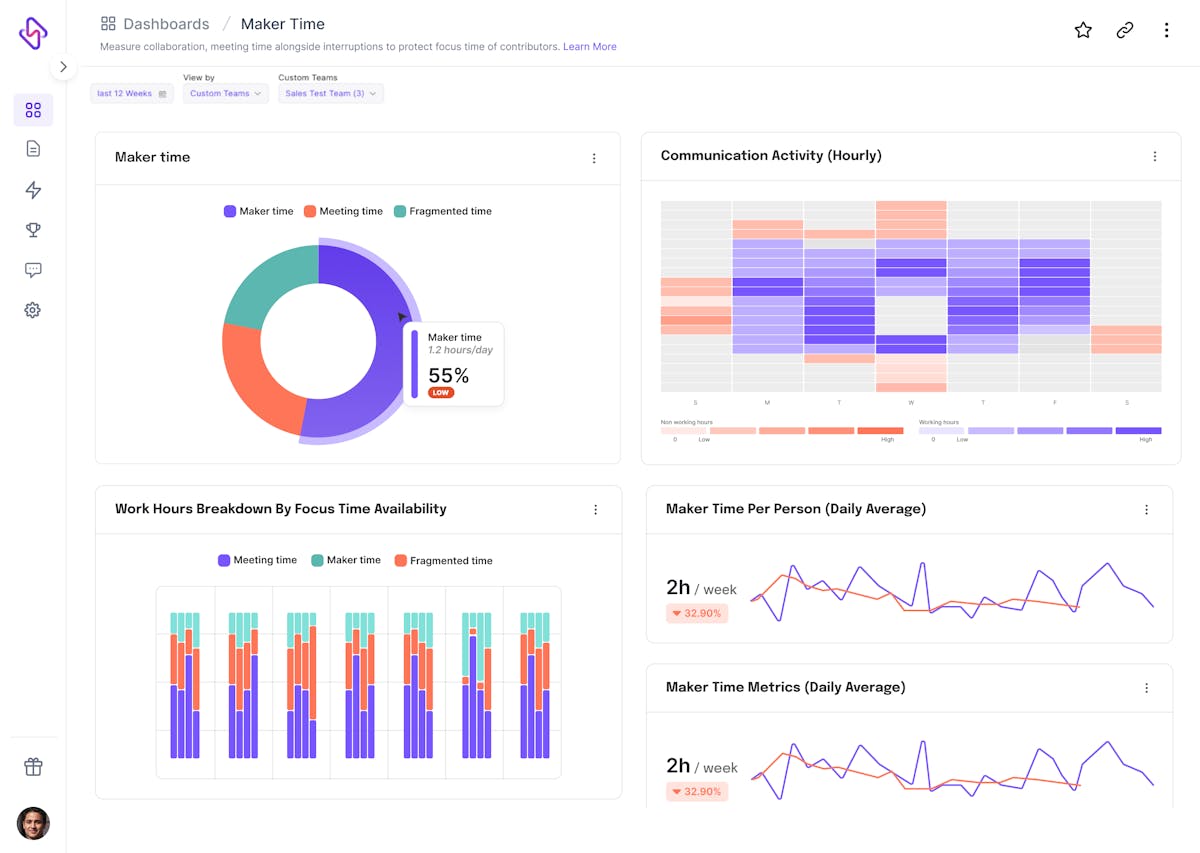
Is it low maker time?
Maybe John is a victim of meeting creep?
Maybe the backlog item was too complex for John? If yes, then diagnose further whether this is a case of poor workload allotment & planning, or if John is genuinely struggling to deliver. You may also want to look at the Dev throughput for other members of the team to cross-check that it is just an individual problem and not a team phenomenon. Otherwise, unclear requirements could be a probable reason for low throughput.
Is John excessively involved in reviewing PRs? Again, this could be due to broken code review processes, which may need your attention.
Probably, John needs more uninterrupted time and a better work-life balance.
- Are the issues without PRs that John has committed too high?
Well, this could be a case of poorly managed scope creep. Look at Lines of Code (LoC) metrics by John, and if that too is high, it could indeed be a scope creep issue.
You need to continue with the root cause analysis (RCA) process, until you’ve figured it out. Accordingly, you can find a solution.
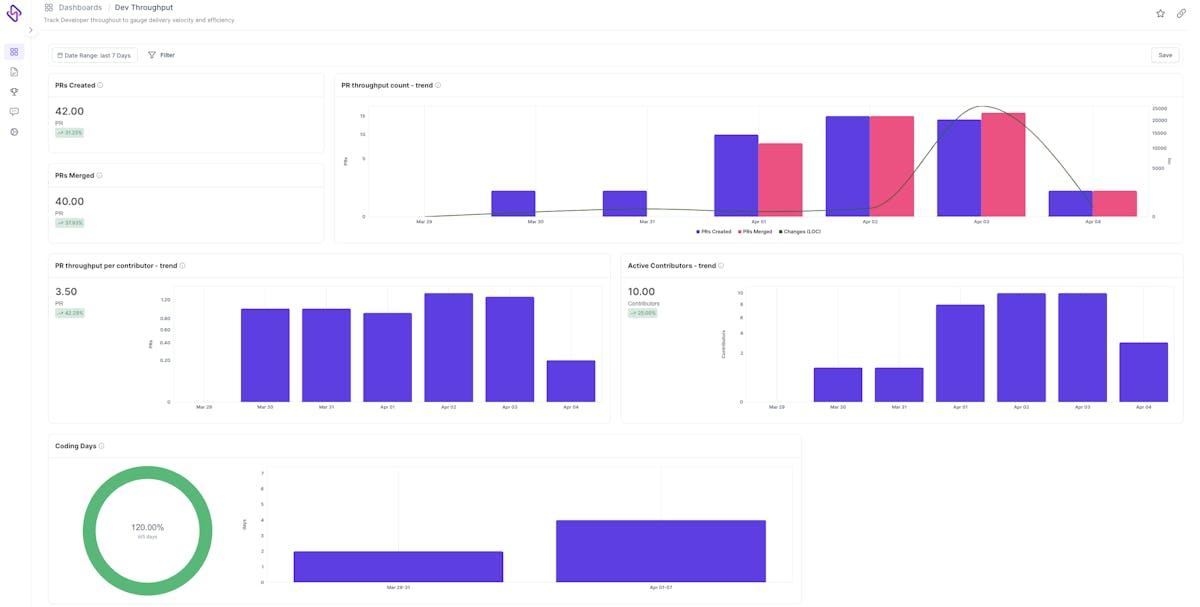
Case 2: Let’s say, individual dev throughput for John unexpectedly skyrocketed in the last week for an ongoing sprint. John is a backend Python developer working on a healthcare EHR application.
As an engineering manager, who is keen to help your team be at their best selves, you would want to look at code churn, coding days, maker time, involvement, quiet days, and so on.
- If code churn is high, it is an indication John is pushing suboptimal code to production. This also signals that subpar code is made through the code review, and hence, the code review process is broken too.
- If coding days, maker time, and quiet days are high, or if involvement is low, then it’s possible that the engineering processes in your organization are more streamlined.
- Or maybe, inculcating DevOps culture is finally bearing its fruits?
- Or maybe, it’s because you’re using Hatica the right way to identify & fix bottlenecks in your engineering processes?
What??
It’s not hard selling (smirk).
Our customer, BobbleAI improved delivery velocity by 220%.
Anyway, the point is that you must measure developer throughput to diagnose what’s wrong, and to maximize what’s working in favor of your engineering teams & projects. Helping developers unlock their full potential is what matters in the end. Because only that will fuel more innovation, more value creation, more happy customers, and more revenue.
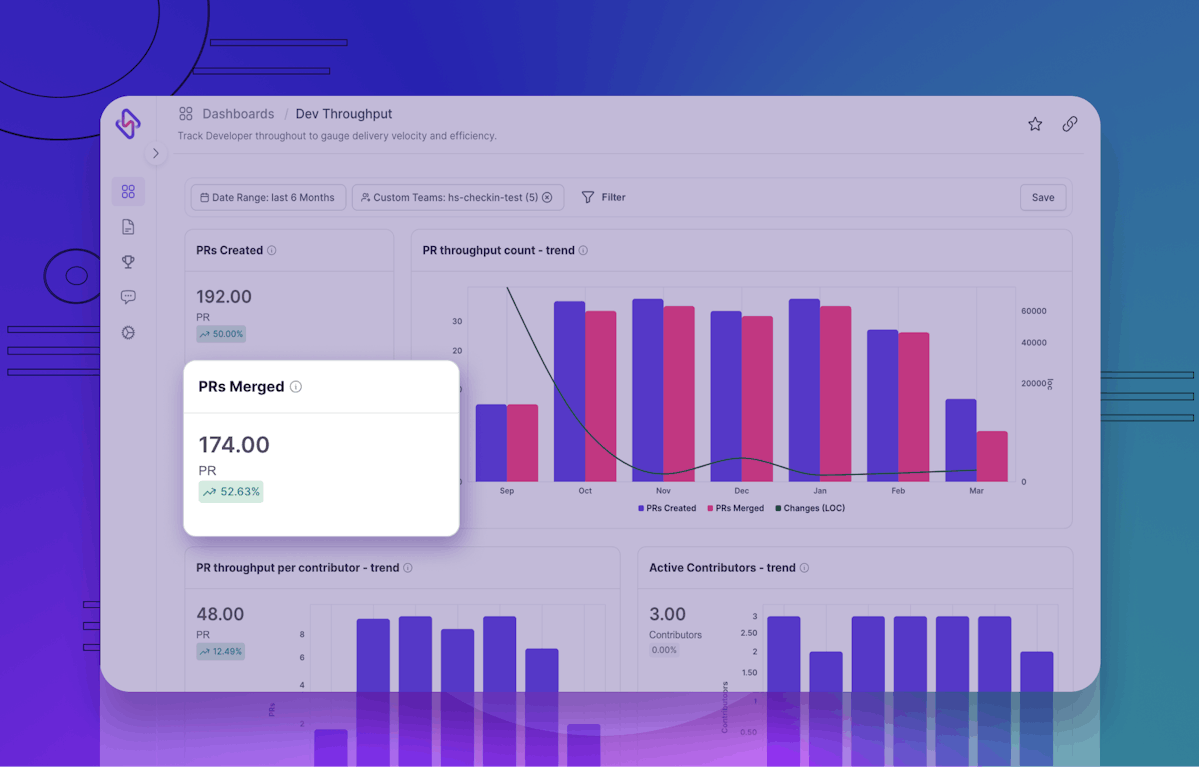
Hatica’s Developer Throughput dashboard helps engineering managers and tech leadership to take a comprehensive look at these metrics both at individual developer level as well as at team level (in the form of aggregated data).
The same data can then be sliced and diced as per project level or teams that are clustered into different geographies. This makes it easier to identify patterns, loopholes, inefficiencies accordingly and not implement a blanket approach to fix what is not broken elsewhere in the organization.
Reading recommendations:
- Dev Throughput is an engineering velocity metric. You must read Hatica Insight on “velocity metrics for improved engineering efficiency” to understand how you should use velocity metrics, and more importantly, how not to use velocity metrics. Teams often go wrong with velocity metrics. They tend to use it as a performance metric. It could be terrible if you use dev throughput as developer performance metrics. You must not use velocity metrics in isolation to measure performance. But if you bring quality & reliability metrics in the same frame, it’s a different game. Find more details in the article.
- Development velocity is akin to dev throughput but at a team level. You must read Hatica Insight on “What is development velocity and how to improve it” to understand in a more elaborate way why development velocity metrics could be a game-changer for engineering teams. Velocity metrics can help make projects predictable. They empower you to effectively plan projects, and efficiently allocate and utilize engineering resources. Find more details about the factors that stifle development velocity metrics like dev throughput, and how you may improve velocity metrics by rooting for developer experience (DevEx), developer’s psychological safety, and data & metrics driven engineering approach, among multiple other factors.
Keep innovating.
Try Hatica, today. It’s FREE to get started. Or else you can also request a demo to talk to our productivity experts.