How to Leverage DORA Metrics to Drive DevOps Success

Learn how DORA metrics can upgrade your DevOps team's software delivery. Keep reading to find out why these metrics matter and get easy-to-follow steps to start using them to boost your team's performance.
How to Leverage DORA 
Metrics to Drive DevOps Success

Software development teams walk a tightrope every day: delivering new features and fixes quickly while maintaining a rock-solid, reliable system. But how do you measure success in this delicate balancing act? Traditionally, a lack of clear, universally accepted metrics made evaluating team performance a challenge.

Many have attempted, with varying degrees of success, to predict software delivery performance without a clear measurement system. However, a fundamental principle in improvement is this: you can't improve what you don't measure.

This need for a standardized framework led to the development of DORA metrics by a team led by Dr. Nicole Forsgren, Jez Humble, and Gene Kim. Through extensive research, they identified four key metrics that differentiate high-performing engineering teams from the rest.

Improving software delivery performance is one of the main goals of DevOps, and here, tools such as DORA metrics can be used to measure and optimize the performance of the software delivery process.

In this blog, we will discuss DORA metrics, how they align with the principles of DevOps, and their impact on software delivery processes. So keep reading to gauge insights on it! 

How DORA Metrics Align with the Principles of DevOps

In a nutshell, DevOps is a collaborative approach to software development that bridges the gap between development and operations teams. It curates faster development cycles, smoother deployments, and higher-quality software. At the end of the day, DevOps allows teams to deliver value to customers more efficiently.

But when it comes to implementing DevOps performance for big projects, do you ever feel like you're lost in the fog? Here’s where DORA metrics can be your guiding thread, helping you!

The beauty of DevOps is that it breaks down the walls between developers and operations, letting them work together seamlessly. This metric amplifies this by giving everyone a bird's-eye view of the entire development process. When you can see how each step impacts the big picture, it keeps everyone motivated and focused on shared goals.

DORA metrics are like little stepping stones on the path to continuous improvement. Every successful deployment, every decrease in errors, becomes a win that propels you forward. This quality of DORA’s output perfectly aligns with the core principles of DevOps, ensuring development and operations are working in perfect harmony to achieve amazing things.

But why exactly are these metrics so important? Let's dive deeper and see how DORA can transform the way you develop software. 

💡Additional Read: 4 Key DevOps Metrics for improved efficiency and performance

What is the Importance of DORA Metrics in DevOps? 

Incorporating DORA metrics is much more than just tracking numbers; it's about understanding your development process at a deeper level. 

DORA metrics act as a compass and point you towards the direction of building high-performing software engineering teams. Developed with inspiration from Lean manufacturing principles, these metrics categorize teams from "low performers" to the industry's "elite." They work particularly well when integrated with DevOps practices.

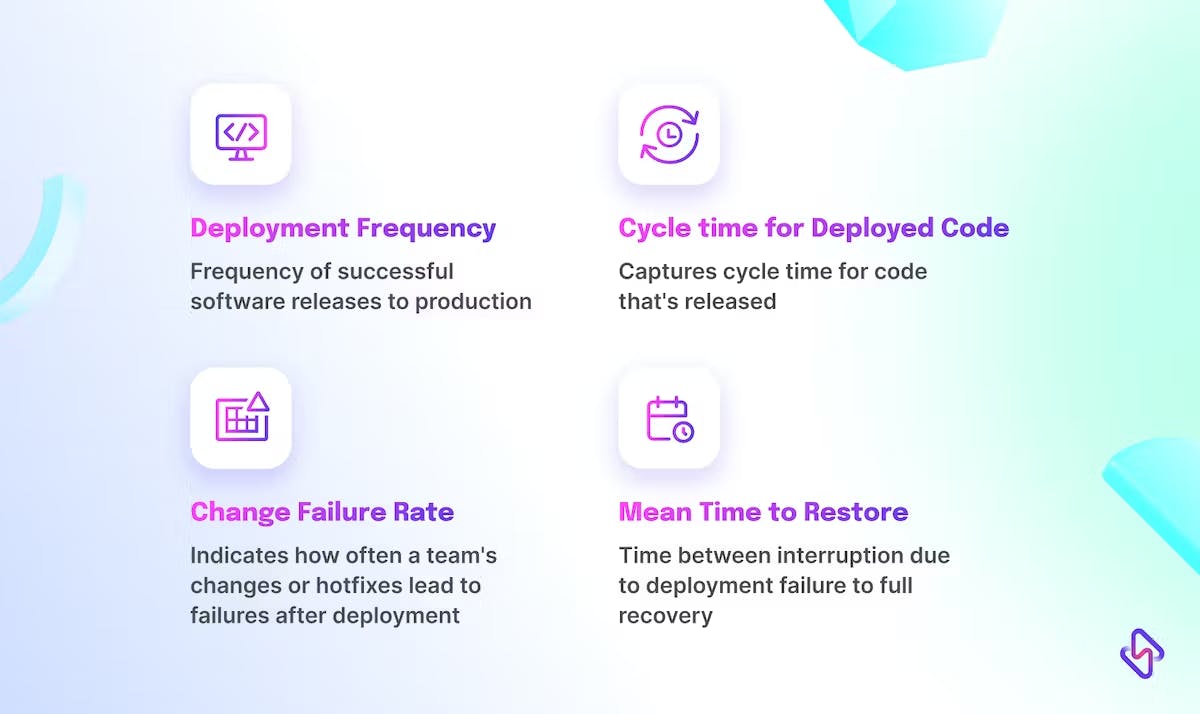
We've got a detailed blog diving into the nitty-gritty of DORA metrics. But here's the gist: high-performing organizations excel in mainly four areas: Deployment Frequency (DF), Cycle Time (CT), Lead Time for Changes (LT), Mean Time to Restore (MTTR), and Change Failure Rate (CFR). 

These areas form the foundation of DORA metrics and offer tech leaders a powerful tool for performance assessment and data-driven decision-making to drive organizational success.

But how exactly do these metrics reflect DevOps processes?

Four DORA Metrics
  • Well, Deployment Frequency is the heartbeat of an average development cycle. High frequency means your team is delivering value to users quickly and efficiently, indicating a healthy DevOps practice. Read more on Deployment Frequency here. 
  • Cycle Time tells you how long it takes a change to go from development to deployment (e.g., one day). Lower cycle time generally leads to higher deployment frequency. It reflects how fast your team can take an idea, develop it, test it, and release it to production. Read how reducing cycle time can help you push higher velocity for software.
  • Lead Time for Changes measures how fast an engineering team can move from code committed to code successfully running in production. Short lead times indicate a smooth, streamlined process, thereby minimizing delays and keeping momentum high.
  • Change Failure Rate is all about quality. It tells you how often your changes lead to failures in production. Lower rates mean fewer disruptions and higher reliability, which is crucial for maintaining a robust system.. Read more on the Change Failure Rate here. 
  • Mean Time to Restore measures how quickly you can recover from a failure. The faster you bounce back, the less impact on your users and the more resilient your system. Read more about MTTR here. 

Focusing on DORA metrics encourages smaller, more frequent releases, which reduce the risk associated with big-bang deployments and simplify troubleshooting.

By integrating these metrics into their DevOps practices, organizations can make informed decisions for their next move, and tech leaders can loom toward building high-performing teams that deliver value consistently and reliably.

Now that we have a fair understanding of the importance of DORA in building DevOps practices, let’s dive into how you can leverage and apply DORA metrics effectively.

How to Implement and Leverage DORA Metrics for DevOps Success?

Implementing DORA metrics is quite tricky. 

That’s why it's important to look at all four measures together to implement them correctly. For example, a high deployment frequency with a low failure rate might seem ideal, but a long lead time for changes indicates inefficiency. You might need to break down work into smaller chunks or streamline approvals. Therefore, you need to think through how you can approach and get started with DORA Metrics. Here’s one tried and tested approach.

  1. Gather Data: Collect data from all stages of your DevOps pipeline, including changes, incidents, and deployments. 
  2. Organize Your Data: Structure the extracted data into tables for changes, deployments, and incidents. This provides a clear view of each aspect.
  3. Calculate Performance: Use the organized data to calculate your performance against the four DORA metrics. This establishes a baseline and helps identify areas for improvement.

Here's where you can consider using an engineering management platform, which not only saves time but also ensures accuracy and consistency in your metrics. It allows you to focus more on analyzing the data and implementing improvements rather than getting bogged down in manual data management.

DORA dashboard from Hatica

While DORA metrics provide valuable insights, simply monitoring them isn’t enough. To truly bring out their power, you need to use them proactively. Here are a few ways how: 

1. Leverage CI/CD Pipelines:

Integrate DORA metrics into your CI/CD tools. This allows for automatic data collection on deployment frequency and lead time, helping you identify bottlenecks and streamline deployments.

These pipelines are the foundation of DevOps. Integrate DORA metrics directly into your CI/CD tools (Jenkins, GitLab CI/CD, CircleCI) to automatically collect data on Deployment Frequency (how often you deploy) and Lead Time for Changes (speed of changes through the pipeline). 

This real-time data helps identify bottlenecks and streamline deployments.

2. Automate Monitoring and Alerts:

Don't wait for problems to arise. 

Use monitoring tools to track change failure rate and mean time to resolve (MTTR). These tools allow for data visualization, dashboards, and automated alerts for deviations. This ensures prompt issue resolution and minimizes downtime.

3. Establish Clear Incident Management Processes:

Rapid recovery is key to a low MTTR. 

Develop and document clear procedures for incident response. Ensure your team understands escalation protocols, knows where to find critical documentation, and can communicate effectively during incidents. Regular drills keep everyone prepared and expedite response times.

4. Drive Data-Driven Decision Making:

Leveraging DORA metrics helps you make smarter, data-driven decisions in your DevOps environment, leading to a more informed, efficient, and agile workflow. If you notice that your lead time is high, it could signal bottlenecks in your development process. By examining specific stages like cycle time and pinpointing slowdowns, you can streamline these areas and reduce overall lead time.

Keep in mind that improvements in one area can sometimes affect others. For instance, rapidly increasing deployment frequency might temporarily raise change failures. 

DORA metrics help you navigate these trade-offs, ensuring you optimize your DevOps practices as a whole. This balanced approach allows you to enhance performance without compromising stability.

💡 Read More: An Engineering Leader's Guide To Building a Data-Driven Engineering Team

5. Align Metrics with Business Objectives:

DORA metrics are powerful, but their true value lies in how they support your overall business goals. The first step is to clearly define your primary objectives, such as improving customer satisfaction, increasing market share, or enhancing product quality. These goals will guide you in prioritizing which DORA metrics are most relevant.

For example, if customer satisfaction is a priority, focus on metrics that directly affect user experience. This might include Mean Time to Restore (MTTR) which minimizes downtime after an issue, and Change Failure Rate which reduces the number of errors encountered by users.

By connecting each DORA metric to a relevant business objective, you can use data into actionable insights. From this point onwards, you can analyze the data to identify areas for improvement and prioritize them based on their potential impact on your business goals. This strategic alignment ensures that your DevOps efforts contribute directly to achieving your overall business objectives.

Use DORA Metrics for DevOps Success 

Imagine compiling and deploying a new version of your software with lightning speed. Everything seems perfect until you run the program and encounter errors. It's like compiling code that looks flawless on the surface, but when you execute it, it throws exceptions and crashes. Not the seamless user experience you were hoping for, right?

DevOps is similar. You want to deliver software updates quickly, but you also need them to be stable and reliable. This is where DORA metrics give you the balance between speed, quality, and delivery.

While reaching "DORA Elite" status, known for exceptional performance in these metrics, might be a long-term goal, the journey starts with steady and measurable progress. Every improvement, no matter how small, contributes to building a high-performing DevOps environment.

If you’re looking to implement DORA metrics into your engineering processes, seeking expert guidance can be incredibly beneficial. Our productivity experts can help you understand how to effectively gather and analyze data, set up appropriate tools, and integrate these metrics into your workflows. 

Subscribe to Hatica's blog

Get bi-weekly insights straight to your inbox

Share this article:
Table of Contents
  • How DORA Metrics Align with the Principles of DevOps
  • What is the Importance of DORA Metrics in DevOps? 
  • How to Implement and Leverage DORA Metrics for DevOps Success?
  • 1. Leverage CI/CD Pipelines:
  • 2. Automate Monitoring and Alerts:
  • 3. Establish Clear Incident Management Processes:
  • 4. Drive Data-Driven Decision Making:
  • 5. Align Metrics with Business Objectives:
  • Use DORA Metrics for DevOps Success 

Ready to dive in? Start your free trial today

Overview dashboard from Hatica