Productivity2024-06-25

Applying SPACE Framework to Measure Developer Productivity

The SPACE framework offers a well-rounded approach to developer productivity and building healthy teams. In this blog, learn the right way to apply it to practice.
SPACE Framework

While our fascination with developer productivity has been constant over the years, our understanding of it keeps evolving. After talking to many engineering teams, one thing became clear: traditional metrics don't tell the whole story.

Metrics like lines of code or commits, while common and reliable, provide an incomplete picture. They often overlook crucial aspects like quality, developer well-being, and teamwork.

This limitation wasn't lost on researchers at leading institutions like GitHub, Microsoft, and the University of Victoria. They recognized the need to move beyond traditional metrics for a more holistic view of developer productivity.

That's why the SPACE framework was introduced in 2021. It resonated deeply with us because it mirrored our experiences with traditional metrics and fundamentally changed our approach to measuring productivity.

Before SPACE, the industry focused heavily on activity-based metrics – easily quantifiable measures that missed crucial aspects. However, SPACE offers a multi-dimensional approach, highlighting the importance of developer happiness, communication, and smooth workflows.

We cover the SPACE framework in depth in this blog, but here’s a quick run-down:

SPACE Framework defiition
  • Satisfaction and Well-being: How satisfied are developers with their work and working conditions? Are they healthy and happy?
  • Performance: How well does the software fulfill its intended purpose? This includes quality and the impact on users.
  • Activity: This counts actions within the system, like the number of tests, builds, and design documents produced by the team.
  • Communication and Collaboration: How well do team members communicate and work together?
  • Efficiency and Flow: How smoothly can the team complete work with minimal interruptions and continuous progress?

The SPACE framework emphasizes the importance of all five categories. It combines workflow metrics (like those used in DORA) and perception metrics and pushes us to look at developer productivity in a broader light.

But how exactly does SPACE address this gap and pinpoint areas for improvement? We discuss this in-depth below. 

SPACE Framework - The Nuanced Approach to Developer Productivity 

When it comes to measuring developer productivity, DORA metrics have their place, but they largely focus on the final product, like how quickly we get features out the door.

But what about everything that goes into making that product? Are we writing clean, maintainable code? Are we working together smoothly as a team? Do we have enough uninterrupted time to write complex lines of code?

Relying too much on those traditional metrics can be a trap. We've learned that you can’t directly improve developer happiness with objective metrics.

Why?

Because these metrics often reduce productivity to just how fast features are delivered or the amount of work completed. They risk treating developers as just technical resources, overlooking their broader contributions to the organization. This approach fails to provide engineering leaders with a complete understanding of their teams' overall performance and the long-term impact of their efforts.

This is where the SPACE framework gives you a five-dimensional approach and persuades you to gauge your engineers’ state of mind. By incorporating the latest research, SPACE helps ensure no important aspect of productivity is overlooked.

So, how do you actually put the SPACE framework into practice? 

We unpack this in the next section of the blog.

How to Apply the SPACE Framework in Engineering Analytics? 

Data is a powerful tool for sharpening our understanding of developer productivity. By leveraging data we add an objective layer to applying the SPACE framework which otherwise comes across a subjective outlook towards measuring and improving developer productivity for engineering teams. Yes, the goal is to gain a holistic view of productivity and ensure we're covering all the grounds.

Here’s how you can incorporate SPACE into your engineering analytics processes.

Satisfaction and Well-Being

It's no secret that burnt-out developers are less productive. 

Studies like Software.com's Future of Work 2023 report highlight the culprits: poor work-life balance, constant disruptions, and inefficient tools. If these situations align with the state in which your developers push through and deliver their work, you need to pause and ask if your developers are truly happy.

One way to boost their well-being is to make sure they have plenty of maker time – uninterrupted periods for deep work and brainstorming. This can really help them focus and produce their best work. But only if you know that your developers are facing burnout.

You can also keep an eye on how often code is rewritten. When developers are focused and content, the quality of their code improves, meaning fewer revisions are needed.

Code Churn metrics

The key here is to listen, absorb, and observe. Are they showing enough participation during stand-ups and while being involved in projects? If you can gauge their behavior, how are they feeling?

Standup Metrics

You can conduct regular surveys and feedback sessions within your teams. Simple questions like "How satisfied are you?" or "Do you feel supported?" can unearth areas for improvement. By addressing these concerns, you're laying the groundwork for a thriving development environment.

Also, you an ensure that developer sentiment is substantiated by relevant data points to back the findings and thus enable you as an engineering leader to take much-needed steps. 

Here's what you can do to keep an open channel of communication with your engineering team:

  • Conduct regular surveys and feedback sessions.
  • Implement flexible working arrangements to boost satisfaction and productivity.
  • Regularly review and optimize tools and processes to minimize disruptions and inefficiencies.

This will ensure that your software engineers and developers are satisfied with what they are working on and how engineering operations are being run.

Now, let's shift gears and focus on Performance.

Performance

At first glance, having your engineering team continuously deliver new features might look like peak productivity, but there’s more to performance than meets the eye. Real success in software development isn't just about making things; it’s about making things that matter—creating software that users love and that really drives business value.

We lean on vital metrics like user feedback, bug rates, return on investment, and how widely new features are used. These indicators help ensure that our software isn’t just functional—it’s outstanding.

Now, let's connect this to our team's work. This insight allows engineering leaders to clearly see how much work everyone is handling and where our efforts are going.

Investment Workflow Engineering Metrics

The key is to ensure this workload aligns with the organization's overall business goals. Working hard is great, but if that work doesn't redirect us to our goals it's not as valuable.

Here's what you can do to track Performance:

  • Collect and analyze user feedback to understand how users feel about new features.
  • Monitor bug rates to identify areas needing improvement in code quality and stability.
  • Regularly track resource allocation. If a project requires more attention, we can shift resources to ensure success.
  • Track feature adoption rates to gauge user engagement and satisfaction.

Now that we have seen how Satisfaction, Well-Being and Performance can be articulated with both subjective inputs and objective findings, it is important to map developer activity across the engineering systems and work environments.

Activity

We track a lot of activity: code commits, pull requests, and tests run. These numbers offer a glimpse into our development process, but they're just the tip of the iceberg. A high number of commits might seem impressive initially, suggesting a productive team churning out code. But what if those commits are primarily bug fixes? This could hint at underlying code stability issues, requiring further investigation.

Hence it is imperative to capture activity metrics along different phases of the software development life cycle and quantify developer activity at scale.

For that, we need to dig a bit deeper. Here's where you can leverage quantitative data and measure key metrics like cycle time.

Cycle Time - Hatica 3.0

How many commits are happening today? How long does it take for someone to review a pull request (PR)? On average, how long do reviews typically take? This will further translate into looking into CI/CD processes, test coverage, incidents reported/ worked-on, on-call participation, and time spent over calls to resolve issues, etc.

Once you have all these questions answered, the same can be used for a meaningful conversation during sprint retrospectives and follow-up discussions for a more balanced activity distribution amongst team members within and across various teams.

Here's how to get the most out of this data:

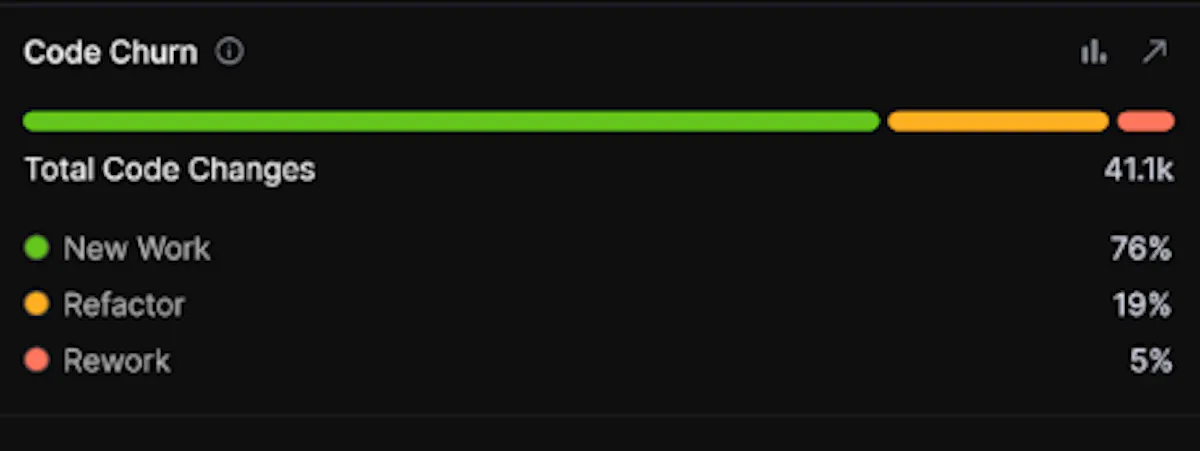
  • Track coding metrics like code commits, PR Reviews, merge rate, cycle time, test coverage, etc.
  • Identify operational activity for each individual on various aspects such as testing, incident reporting and mitigation,
  • Analyze the context behind these metrics in meetings to identify potential issues and the overall picture.

It is important to note that these Activity metrics should never be looked at in isolation to form judgment or opinion about any particular individual or overall team engineering productivity. The role of data is to give an objective perspective and establishing Communication (which we talk about in the next section) will help you get a clearer picture of the situation on-ground. 

Communication and Collaboration

Just like a strong building needs a solid foundation, successful software development relies on effective teamwork. Here's where communication and collaboration metrics come into play. These metrics help us understand how well our team interacts and works together, ultimately revealing areas for improvement.

Communication tools like Slack, Google Meet, or Microsoft Teams provide a wealth of data on our communication patterns. By analyzing this data, we can see things like:

  • Frequency of communication: Are team members talking frequently enough to stay on top of things, or are there communication silos?
  • Distribution of communication: Is everyone involved in discussions, or are there a few voices dominating the conversation?
  • Response times: How quickly are team members responding to questions and updates?

Understanding these patterns allows us to identify potential roadblocks and promote a more inclusive and efficient communication flow.

Beyond communication, we also want to improve how well our team collaborates. Here, metrics like code reviews and pair programming sessions offer valuable insights.

For instance:

  • Code review efficiency: How long does it typically take for a code review to be completed?
  • Depth of code reviews: Are reviews comprehensive and provide valuable feedback?
  • Frequency of pair programming: How often are team members working together on code?
  • Effectiveness of pair programming: Do these sessions lead to improved code quality and developer learning?

By analyzing these metrics, we can identify areas to improve collaboration practices. Maybe we need to streamline the code review process, encourage more pair programming, or implement additional training to enhance teamwork skills.

The most fascinating part of this dimension of developer productivity - Communication and Collaboration - is it not only builds better teams but also feeds back to other dimensions as well leading to higher developer satisfaction, higher team performance, and distributed activity across other software engineers.

This results in getting engineering teams better at - what we call the final dimension of the SPACE framework - Efficiency and Flow.

Efficiency and Flow

Imagine a smoothly flowing river, efficiently carrying water from its source to its destination. That's the ideal state for software development: a steady, efficient flow of work. This dimension focuses on measuring that very flow – how smoothly work progresses from conception to completion.

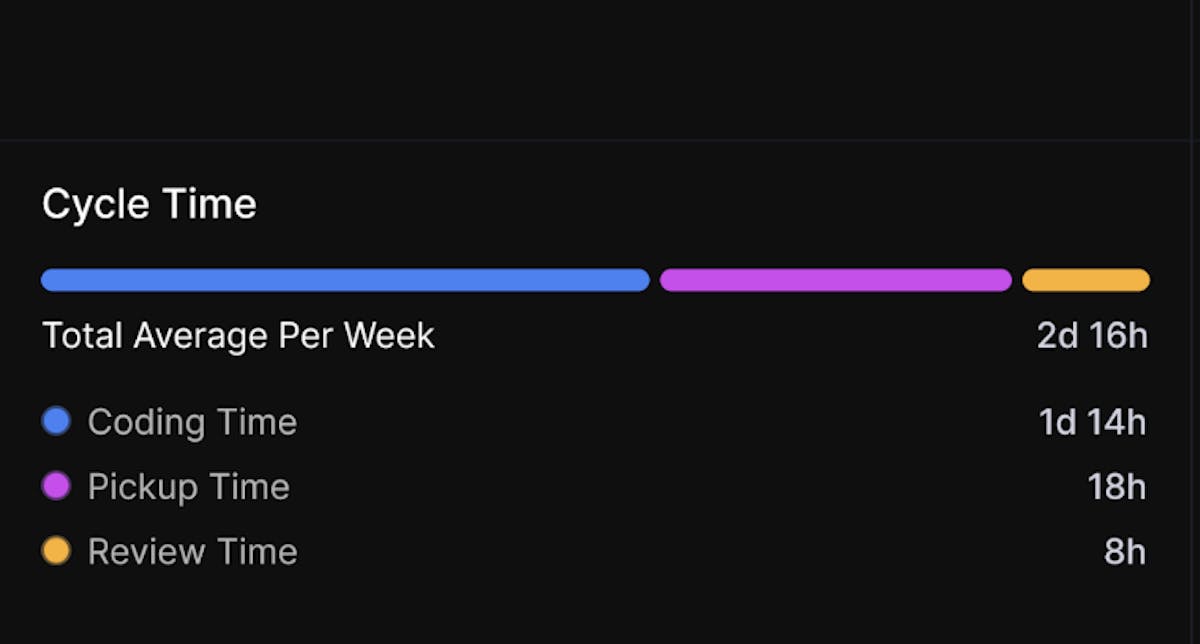
Several quantitative metrics help us identify bottlenecks and inefficiencies in our workflow: Cycle Time, Lead Time, Deployment Frequency, and more. 

By monitoring these metrics, we can identify areas where work is getting stuck. Maybe reviews are taking too long, or deployments are overly complex, or there are undue delays in shipping code to production. Once we pinpoint these bottlenecks, we can take steps to streamline the workflow and get that development river flowing smoothly again.

This focus on workflow efficiency translates to several benefits:

  • Faster Time to Market: With a smoother workflow, we can get features and fixes to users quicker, keeping them happy and engaged.
  • Improved Team Morale: When the workflow is efficient, developers spend less time stuck on roadblocks and more time doing what they love – building great software.
  • Reduced Costs: Streamlining the workflow can lead to cost savings by minimizing wasted time and resources.

Ultimately, by measuring and improving our development workflows, we can ensure a smoother, faster, and more efficient path to delivering high-quality software.

The Bottom Line

Let's face it, even the most well-thought processes need a tweak every now and then. Especially in the software development world, where things move at lightning speed, it's easy to get stuck in our ways or traditional methods. This is because these ways can be a bit one-dimensional, focusing on what gets done without considering the "who" and “how” behind it.

That's where the SPACE framework urges us to have a fresh perspective on developer productivity, bridging the gap between qualitative and quantitative data and highlighting key ingredients we might be missing to truly level up our engineering efforts.

If you're looking to follow SPACE's lead and bring a more well-rounded and holistic approach to developer productivity, our productivity experts are the folks you want to talk to! They can help you craft a plan that fits your team perfectly.

Thanks for reading, and taking a nuanced approach to applying the SPACE framework to measure and improve developer productivity. 

Subscribe to Hatica's blog

Get bi-weekly insights straight to your inbox

Share this article:
Table of Contents
  • SPACE Framework - The Nuanced Approach to Developer Productivity 
  • How to Apply the SPACE Framework in Engineering Analytics? 
  • Satisfaction and Well-Being
  • Performance
  • Activity
  • Communication and Collaboration
  • Efficiency and Flow
  • The Bottom Line

Ready to dive in? Start your free trial today

Overview dashboard from Hatica