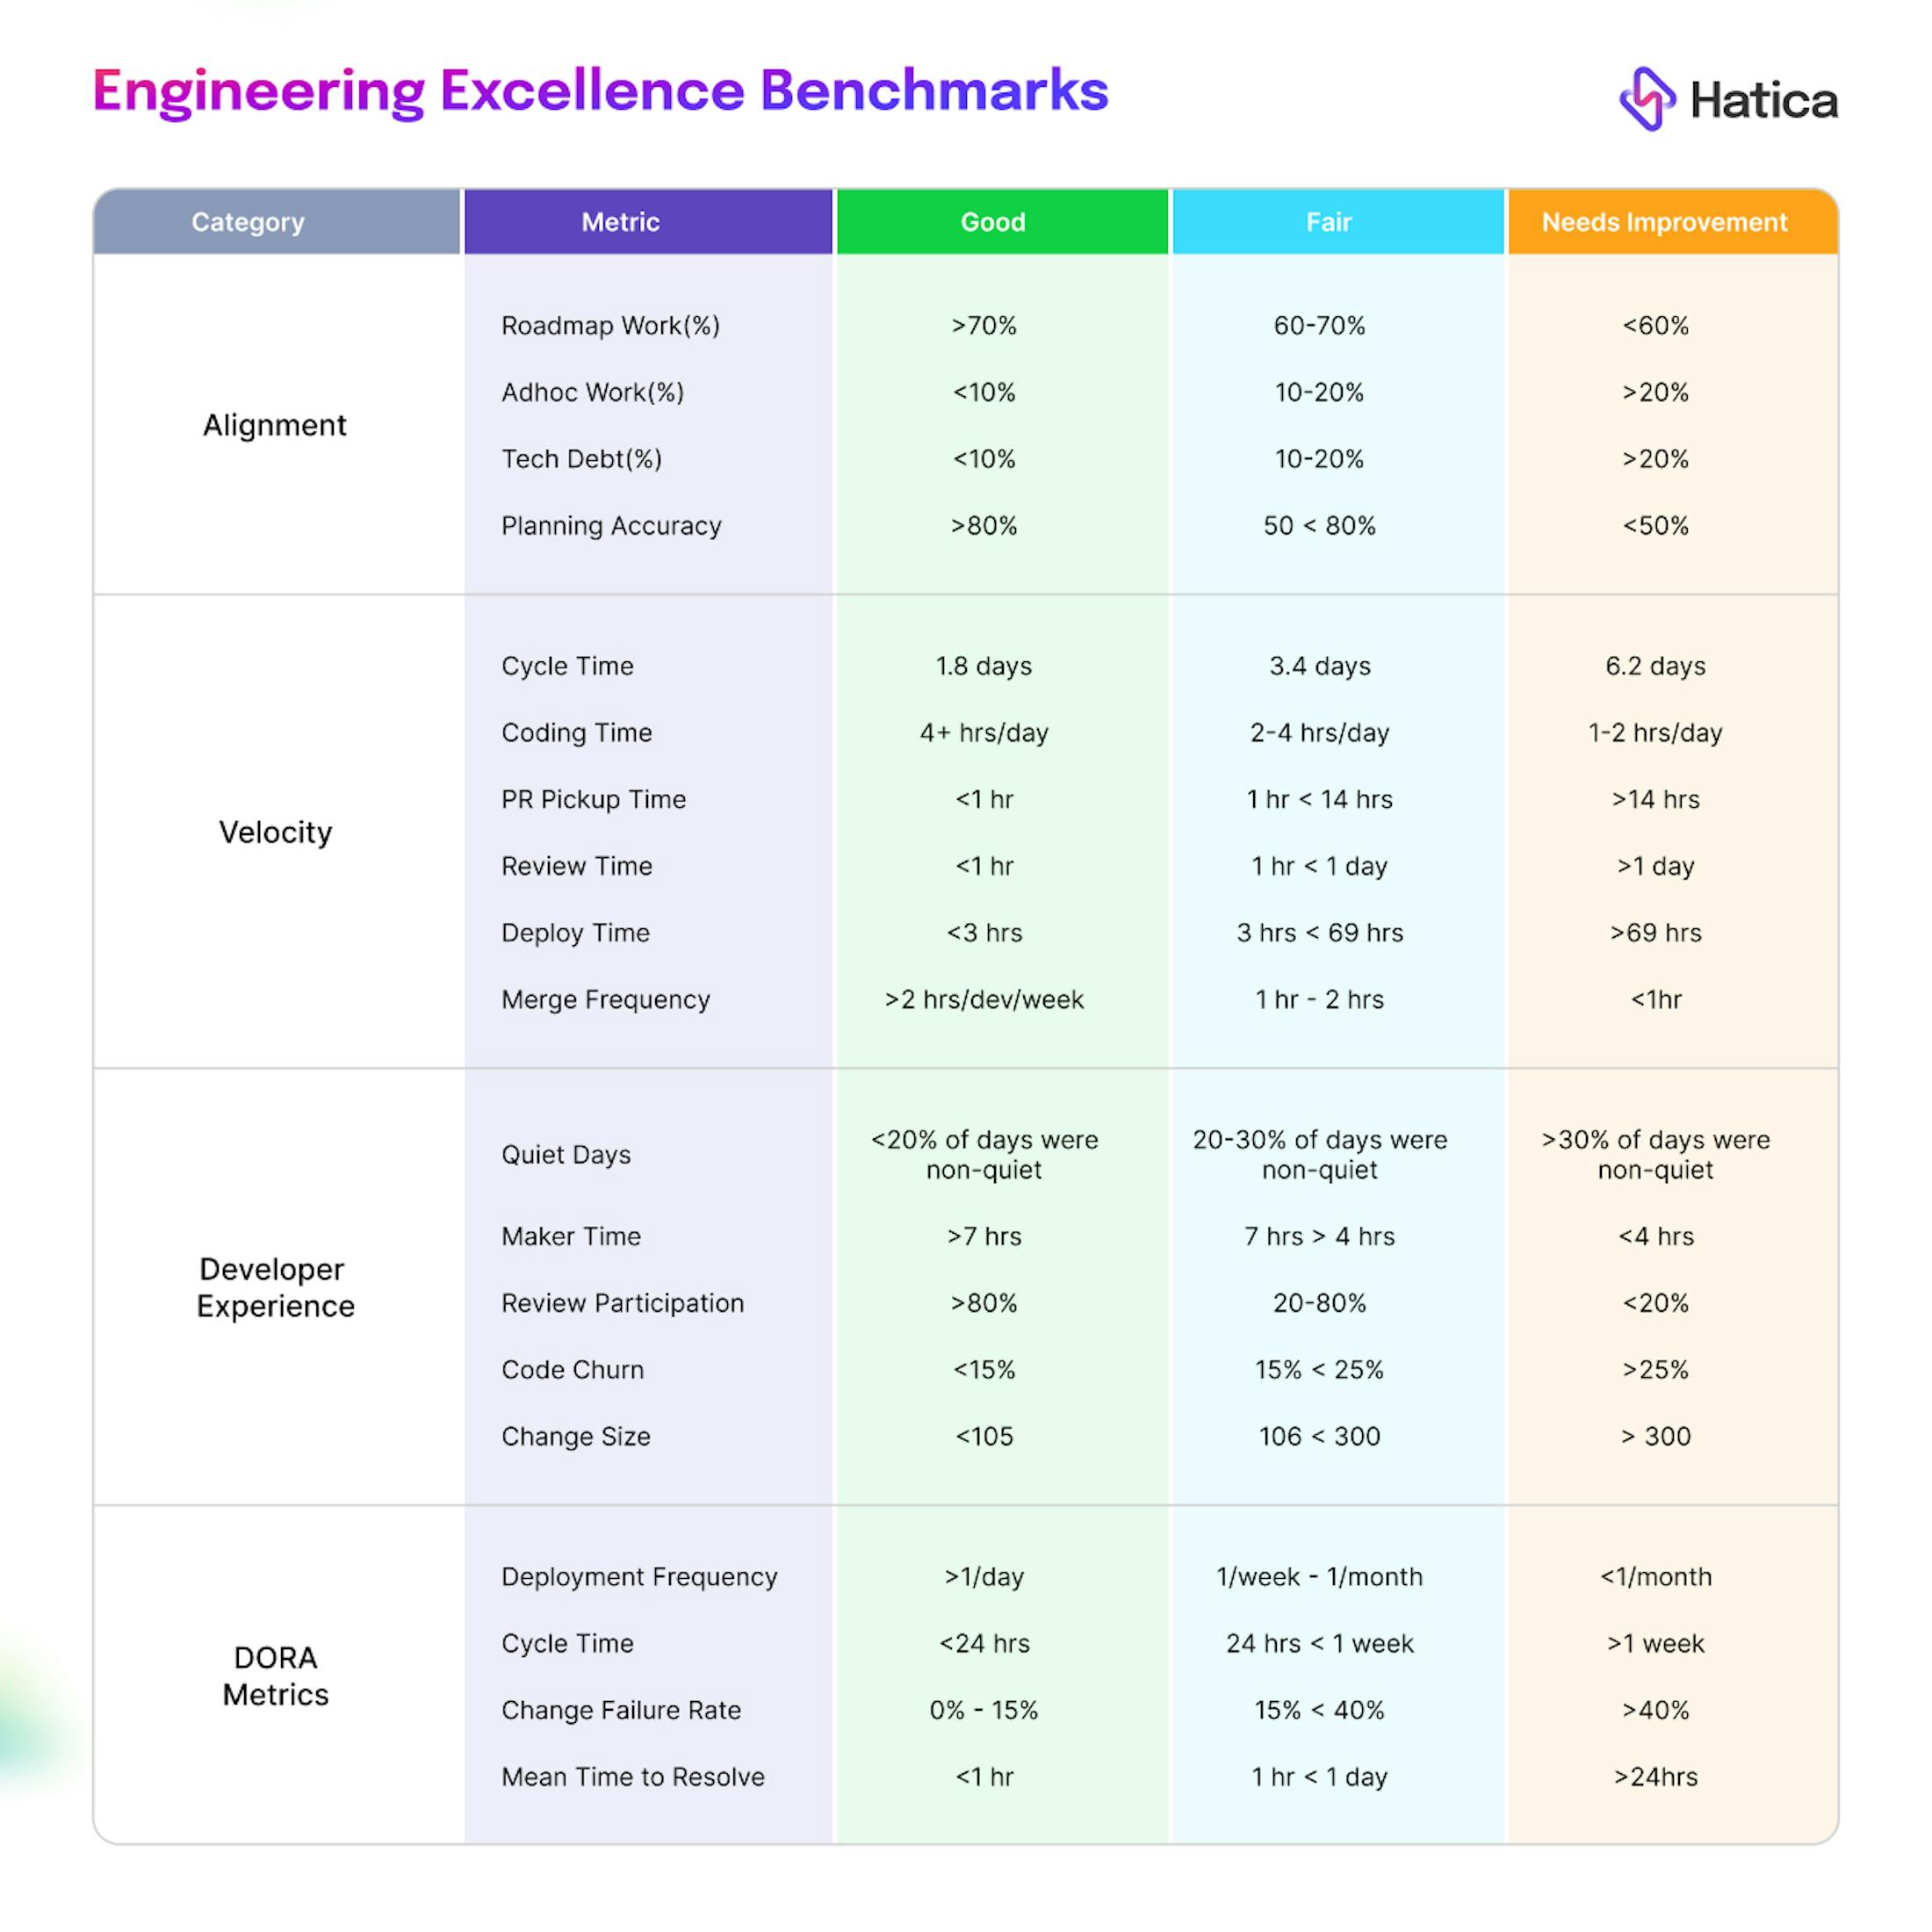
We’ve boiled down these benchmarks into four key areas: Alignment, Velocity, Developer Experience and Quality. These pillars line up with the DORA metrics and cover the core aspects of a team's performance and sustainability.
Why These Four Pillars Matter?
We’ve identified four crucial areas for a team's performance and sustainability: Alignment, Velocity, Developer Experience, and Quality, all aligned with DORA metrics. Alignment ensures everyone works towards the same goals, boosting motivation and synergy, even though some non-roadmap work is unavoidable. Velocity measures how quickly work is completed, but it needs proper alignment to be effective; otherwise, it can be counterproductive. Balancing alignment and velocity can be challenging, and this is where Developer Experience comes in, focusing on team health and managing technical debt to prevent burnout. Quality is essential for user satisfaction, emphasizing regular deployments and high standards to build trust and avoid last-minute crises.
These four pillars aren't magic solutions, but they provide a solid direction for any engineering team. By focusing on them, teams can move beyond guesswork and build a team that’s not just fast, but also efficient, healthy, and producing top-notch work.
Now that we have this definitive context behind the four pillars, let's view these engineering benchmarks and how many engineering teams are leveraging them.
Alignment
1. Roadmap Work
Roadmap work helps your team understand the "why" behind their daily tasks. By seeing how your work contributes to the bigger goals, you feel more invested and motivated, and as you complete sprints, your roadmap becomes a record of what's been accomplished.
This allows you to identify any gaps between your initial plan and reality. Maybe certain features are taking longer than expected, or new priorities have emerged.
By regularly reviewing your progress against the roadmap, you can identify the need for course correction. Maybe a roadmap goal needs to be adjusted, or a sprint needs to be replanned. The roadmap helps you stay agile and adapt to changing priorities.
2. Ad Hoc Work
The ideal way to work is to plan out the work, map out the objectives, and then just do it. But in today’s engineering teams, unexpected issues and external dependencies are part of the game. That's why most teams schedule some buffer time.
However, if unplanned work starts eating up more than 10% of your developers' time, that's a red flag, and you need to monitor your systems to identify the issue. The challenge is most of the time this “ad hoc work” goes unnoticed or gets noticed when a team has slipped timelines on multiple deliverables time and again.
3. Technical Debt
One sneaky metric that can derail your goals is technical debt. Think of it like accumulating interest on a credit card – it might seem manageable in the short term, but it can slow you down significantly in the long run.
Best-in-class engineering teams maintain technical debt at less than 10% of their total development effort, ensuring sustainability and agility. If your team's tech debt is creeping above 20%, it’s time to prioritize addressing these issues.
The more technical debt you have, the harder it is to find what you need and make changes. This can slow down development significantly, making it harder to meet deadlines and deliver new features.
So naturally, tackling technical debt requires going back to the relevant data and figuring out what your next steps are.
4. Planning Accuracy
If most of your team's work aligns with an overall plan, you're on the right track, and your planning accuracy is to be commended. But sometimes, you might notice your sprints go off the rails because your predictions for the sprint weren’t as accurate as you thought they’d be.
Therefore, high planning accuracy can help your team come to a more realistic understanding of how much work can be accomplished in a sprint.
The only way to be accurate with your planning is to have a long hard look at your data, measure how your previous predictions differed from this one, and allocate resources accordingly.
All of these parameters put together give you a clear perspective into how efficient you and your team have been in planning your work, accomplishing the planned work on time and what would it take to achieve a higher level of alignment within your team.
A good benchmark is achieving over 80% accuracy in planning, which suggests your predictions and outcomes are aligned. If accuracy falls below 50%, your planning processes need a serious overhaul to avoid inefficiencies and misallocated resources.
Velocity
1. Coding Time
Coding time is at the heart of SDLC practices. Tracking coding time helps you understand each and every developer’s deep work patterns within your engineering team, enabling you to create an environment that minimizes distractions and allows developers to concentrate.
Elite teams have it down to less than half an hour.
If you notice sudden spikes in coding time for a particular developer, such as clocking in more than 24 hours, it is time to dissect what's clogging up the pipeline.
This can indicate they need extra help or that the task was underestimated during planning. This makes it a very important metric to keep track of.
2. PR Pickup Time
Quick PR reviews keep developers in the zone. Elite teams aim for PR pickup times of less than an hour.
The longer they wait for feedback on their code, the more likely context and momentum are lost.
This can lead to frustration and delays in completing tasks. Therefore, by tracking PR pickup times regularly, you can identify and suggest areas for improvement within your team.
Faster pickup times ensure that code reviews are promptly addressed, keeping the development cycle moving efficiently.
Maybe the data might suggest that you need to assign additional reviewers with relevant expertise or schedule dedicated code review sessions to avoid logjams. This will further help you streamline processes.
3. Review Time
So, we've talked about how long it takes for a developer to get their code reviewed (PR pickup time), but what about the actual review itself? Like many things in life, striking the balance is also the key here: Super-quick reviews might miss critical issues, while excessively long reviews can slow down progress.
By monitoring review times, you can identify trends and ensure reviewers are providing thoughtful feedback without creating bottlenecks.
4. Deploy Time
So, your code is sparkling clean and ready to go. How frequently do you deploy? Elite teams deploy more than once a day, demonstrating remarkable agility.
The longer code sits between development and production, the higher the risk of something going wrong. By streamlining your deployment process, you reduce the window of opportunity for errors to creep in and cause issues in production.
Moreover, quick deployments mean users get new features and bug fixes faster. This allows you to gather real-world feedback sooner and iterate more quickly, keeping your product relevant and competitive.
5. Merge Frequency
There's no one-size-fits-all answer for merge frequency. It all depends on your engineering team's size, project complexity, and risk tolerance.
However regular merges help maintain a smooth flow of integration between different features. More than twice a week places you in the elite category, sparking continuous integration and development. This reduces the risk of merge conflicts, which can be time-consuming to resolve and slow down progress.
But if you're merging less than once a week, it’s a red flag signalling a need to rev up your team’s engine. By keeping an eye on it, you can find the sweet spot that keeps your codebase stable, fosters collaboration, and ensures a smooth workflow.
Cycle time also plays a crucial role in velocity, and monitoring cycle time is almost like peeking into the health of your engineering team. To understand the nitty-gritty of cycle time, we encourage you to give it a thorough read here.
Developer Experience
To maintain a healthy and productive engineering team, we take inspiration from the SPACE framework and focus on five key areas: Satisfaction & Well-Being, Performance, Activity, Communication & Collaboration, and Efficiency & Flow. Ensuring developer satisfaction and retention helps us gauge engagement and productivity.
We break this down in the next section.
1. Quiet Days and Maker Time
We all know those dedicated stretches of time, free from meetings, are essential for deep work. But the reality of software development is constant updates, collaboration needs, and the ever-present "just one quick question" meeting dilemma.
Blocking regular chunks of time away from meetings for your developers helps bridge the gap between ideal and reality. Measuring quiet days gives developers the space for deep work and the opportunity for Maker Time, where they can write intricate and complex code without needing much rework, ultimately pushing to deployment faster.
2. Review Participation
We all know code reviews are crucial for keeping our codebase clean and lean. But sometimes, they can feel like a chore - just another box to tick. The magic happens when reviews become a two-way street, a chance for everyone to learn and improve together.
The key ingredient? Active participation! When everyone gets involved, digs in, and shares their knowledge, the whole codebase benefits.
When this is regularly analyzed and encouraged, the approach to code reviews within developers can change.
3. Code Churn
The more you tinker with the code, the messier it gets. A bit of code churn is normal, especially in the early stages of development. However, constantly rewriting code increases the likelihood of bugs and the overall codebase harder to maintain and understand, complicating the onboarding of new developers and the introduction of future features.
Regularly monitoring code churn encourages developers to spend more time with the code, leading to cleaner, error-free output. This ensures that the final product is easier to maintain and understand, benefiting both current and future team members.
4. Change Size
Following up on code churn, fixing a small bug can be like finding the last puzzle piece - quick and easy! These little fixes are helpful, but too many in a row can slow things down.
Big changes, like overhauling a whole section, are risky. They take longer to check, might cause new problems, and can be confusing for others. This can lead to delays and frustration.
Therefore, the sizes of these changes are an important part of tracking.
Meanwhile, DORA metrics, especially MTTR (mean time to recover), and CFR (Change Failure Rate, and Deployment Frequency act like a scorecard that shows how well your engineering team is performing (these metrics cover many aspects of a team's overall health). We recommend you give them a read here.
Wrap-Up: Reflecting on the Data
By now, you've gathered valuable insight into your engineering team’s health, gaining key insights into your engineering team's performance and current standing.
This information becomes your launchpad for even greater success.
Think of it like this: you, as a leader, have collected crucial intelligence. Now, it is time to identify areas where your team can truly shine. Given the resources and timelines now you are in a better position to figure out an effective course correct to build a high-performing engineering team. You can uncover any potential weaknesses and develop a strategic plan to optimize their effectiveness.
Remember, assessment is just the first step in building a high-performing team. Stay tuned for the next section, where we'll unveil a comprehensive 5-step guide designed to fix a bleeding engineering team and propel them toward peak performance. This blog will give you further insights into the tools and strategies you need for any performance gaps.
Keep an eye out for our upcoming blog post!
Meanwhile, if you’re ready to take the first step and effectively assess your engineering team's health, our productivity experts are here to help. Reach out today, and let’s boost your team’s productivity together.
Catch you in the next one.


