Board meetings could be a little tricky for a CTO.
In an internal meeting, your audience would mostly comprise only internal team members and CXOs. So, in such meetings, you can talk about the technical processes of XYZ project(s), successful milestones of engineering teams, new initiatives, completed projects, engineering metrics, etcetera.
This changes completely when you’re presenting as a CTO to the board of directors.
Attending board meetings as a CTO is not similar to attending another internal meeting..
You can no longer talk about your “engineering things” in isolation or prevailing work silos. There is a tacit expectation of presenting software that was shipped, the velocity at which the work is getting done, customer experience and feedback on these newly released product features, the overall cost of software development, and the ROI of investments in the engineering initiatives.
Net-Net A CTO’s rendezvous with The Board of Directors is going to be about:
- The ROI
- The Impact
- The Future Growth Projections
If there are concerns around technical governance & operational workflow challenges, then the board would want to hear your mitigation strategy for the same.
You might be thinking, “Isn’t that what a CEO should be talking about?”.
And you’re right.
The CEO would most probably touch upon these in detail in the board meeting. But you need to dive a little deeper and help the board of directors understand how aligned is engineering to the business. Basically, you would make the CEO’s promises believable when it comes to the engineering side of things in your organization.
So, what should you present?
Argh! To your disappointment, we are not going to talk about including a welcome slide, intro & agenda slide, or the thank you slide at the end of the board meeting presentation. Sorry. We shall only talk about the meat of the presentation. The core CTO & engineering stuff.
Here are the slides/deck that you as a CTO must include in your board meeting presentation to the board of directors:
11 Essential Slides for a CTO to Present in Board Meetings
Remember, in a board meeting, as a CTO, you’ve only two real friends. No, not the CIO or CEO. But Data & Context.
So, know your data. And learn to add context to your data so that board members could easily comprehend what you’re talking about and why it is important.
Having said that here are the slides to include in your CTO presentation deck for the board meeting:
1. Your engineering Health: Summarize Key Engineering Metrics & Recent Launches
Slide 1: Ideally, start with the news about your recent successes. It could be:
- A major launch
- Moving an entire business vertical to the cloud
- Opening up new data centers or offshore development hubs,
- Winning industry awards, etcetera.
Also, help the board members fathom how these engineering advancements map to the overall business charter. Share how these achievements help improve:
- Reliability for a better customer experience (CX)
- Scalability to serve more customers
- Cost-efficiency
Slide 2: Next, talk about how the engineering team has solved one/more major issue(s) which has been a big pain - on the To-Do list - for a long time. For example:
- How did you lower the application crash rate?
- How did you meet the data center outages SLA?
- How have you significantly minimized the peak-hour downtime issue?
- How did you solve the bot attacks mitigation challenge?
Again, show the board members how this translates into the bottom line. For example, bot mitigation helps not only protect your platform data and safeguard your users, but also fixes the cost of operating your IT infrastructure by stopping the bots from accessing your platforms, thus improving cost-efficiency. Also, this would mean more resources are now available to serve real users, thus improving platform speed and reliability.
The point is to break the numbers for the board members. Help them see the business value of engineering initiatives. Avoid subjective information, and always speak in numbers. It helps. A lot.
Slide 3:
The first two slides were for warming up the board of directors. Now, you’re ready to give them insights into the organization’s engineering health.
Beware, do not clog your CTO presentation deck with jargon or irrelevant KPIs & metrics that do not interest the board members. Only include the ones that are of interest to the board executives.
What engineering metrics should you include in the CTO’s board meeting presentation deck?
To answer this, ask yourself the following questions before including engineering metrics & KPIs in your CTO deck for the board meeting presentation?
- Does this metric help demonstrate how technology is supporting our organization’s mission & strategic goals?
- Does this metric impact the bottom line — revenue, profits, and cost savings?
- Does this metric reflect our future readiness?
- Does this metric capture the ROI of recent technology investments?
In general, it’s a good idea to have the following engineering metrics categories on your deck for the board meetings presentation as a CTO:
Show Performance Metrics
Give insights into the overall performance of your IT infrastructure systems & applications. Talk about the enhancements or deterioration in the following:
- Response time (how fast your applications respond to user requests)
- Uptime & availability (how available your system is to users)
- Throughput (transactions handled per second)
- Scalability metrics (elasticity i.e., ease with which you can scale up/down your infrastructure, failure resilience score)
You don’t need to be explaining the HOW, just present the numbers to the board members and map them to ‘how it helps you as an organization to win more happy customers’.
For example, you don’t need to tell how effectively you’re using load balancers for distributing traffic across resources, or how you have implemented algorithms to improve concurrency.
Just talk about:
- How many customers you can serve per minute during peak hours?
- How many transactions can be completed per second?
Then you can throw some light on:
- How these numbers looked earlier?
- What was the failure rate in transactions - before and after?
And then, explain what can be expected with the newly upgraded efficiency i.e., give the board the estimates about what the numbers may look like now as the transaction failure rates have improved. It’s better if you already have that data, and are not making predictions.
How do you collect these performance metrics to include in the CTO presentation deck?
For collecting these metrics, depending on your internal engineering stack, you could use application performance management and monitoring tools like Pingdom, New Relic, Dynatrace, Apache JMeter, Gatling, LoadRunner, AWS Cloudwatch, Prometheus, HPA, Gremlin (chaos engineering tool), etcetera. Ask engineering managers for help with collecting the metrics.
Quality & Reliability Metrics
- Talk in numbers about bug counts, error rates, system downtime/availability, test coverage, Service level agreements (SLA) targets, fault tolerance, data integrity, security attacks & resilience.
- SLA metrics include your security, data, governance, and compliance-related metrics. This also encompasses security incidents, backup, and recovery metrics.
Again, give the board of directors a quick overview about how increased test coverage helps in decreasing bug counts & error rates, which improves system availability, and ultimately helps meet the business outcomes i.e., a better CX & more revenue.
As mentioned earlier, the metrics depend on the industry, if you’re a hardware OEM org or provide IaaS, or PaaS solutions to your customers, SLAs are relevant to you. But in a retail consumer-facing startup like an e-Commerce business or a stock analysis platform, your vendors are responsible for SLAs, not you.
How do you collect these quality & reliability metrics to include in the CTO presentation deck?
You could use application performance monitoring tools (AppDynamics, New Relic), Log management tools (ELK stack, Splunk), infrastructure monitoring tools (Pingdom, Nagios), testing & test management tools (TestRail, OWASP ZAP), and data validation tools (DBUnit), and/or chaos engineering tool (Gremlin).
Slides 4 & 5:
Engineering Efficiency metrics
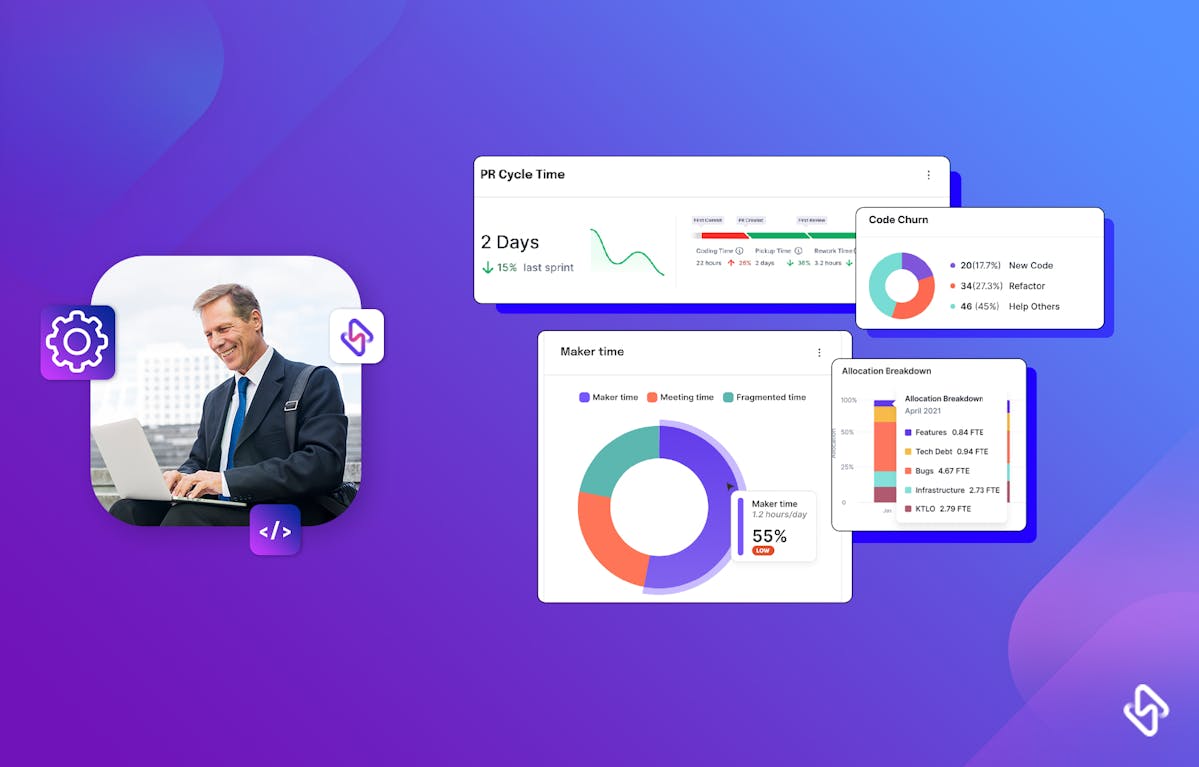
There are 100s of engineering efficiency metrics that you can track (say ‘Hi’ to Hatica), but you need not share all of them in the board meetings.
For example, Hatica helps VP of engineering, engineering managers, and CTOs of startups, SMEs, and enterprises track about 130+ engineering metrics & KPIs. But neither you nor the board members would have time to go through each one of them. So, here is a prioritized list of engineering efficiency metrics with an impact on the bottom line that you, as a CTO, can talk about in the board meetings:
- Mean Time Between Failures (MTBF) is the average time in which your system tends to fail, and needs the attention of the SRE teams or the DevOps teams. The higher it is, the more reliable is your system, and thus the better the CX, and the lower the development & maintenance costs.
- Mean Time To Detect (MTTD) and Mean Time To Repair (MTTR) reflects how fast your team identifies & mitigates the issues. These should be ideally as low as possible. That would mean a quick remedy, and thus it would minimize the negative impact on the bottom line i.e., minimal revenue loss.
- Mean Time Between Deployments (MTBD), Deployment Frequency, Development velocity, the rate at which PRs Merge and other velocity metrics speak load about your engineering efficiency.
Deployment metrics shouldn’t be looked at in isolation, as then it is nothing but a vanity metric. But when you help the board team get a broader picture by looking at these metrics holistically i.e., MTTD, MTTR, CFR, MTBF, Code Churn, and Incident Frequency together, then it gives clear insights about the effectiveness of the SDLC processes.
If you can do some math to find out how x% improvement in Dora metrics (DF, MTTR, CFR) impacts the bottom line in terms of the number of transactions increased, y% revenue increase etcetera, it will be brilliant.
- Change Failure Rate (CFR) gives you the probability of deployments that would need hot fixing, patches, or rollbacks in the future. The lower the CFR, the better. Low CFR means high-quality code is being shipped, and thus low tech debt, and hence low cost of maintenance, and improved system reliability. So, if you’re improving CFR, do bring this to notice, and applaud the team responsible for this.
- Code Churn is a measure of what percentage of code gets deleted after being merged. It’s not the same as refactored code, which is done to improve readability or performance. High Code Churn means poor requirements gathering, scope creep, or exposes the inefficiency of engineering talent & code review process. Low code churn is good for reducing development costs.
- Incident Frequency (IF) is the average number of incidents that happen in a time period. Incidents could be software crashes, network interruptions, data loss, power outages, third-party vendor services failures, human errors, server outages, database errors, etcetera. Instead of diving into each of these, just give an overall view. And demonstrate the ROI on investing in low incident frequency. In some cases, after a particular IF level, investments toward preventing incidents are costlier than responding to them.
- Cycle Time is how long it takes the code to go from the developer’s first commit to the deployment. It includes coding, review, and rework time. Companies strive for lower cycle time. Normally, cycle time is under 4 days for most companies. Low cycle time displays the efficacy of your engineering teams & processes.
- Data Metrics, to give insights into the ROI of investing in data. For example, talk about the percentage increase in revenue attributed to data-driven decisions, and improvement in the accuracy & precision of your predictive models with the increase in data sources integrated for analytics.
- ESG Metrics, to demonstrate how your engineering practices & initiatives have resulted in decreased energy consumption, hence low contribution to the carbon emission (carbon footprint reduction), and the impact on operational costs. Basically, tell the board members how green & sustainable is your engineering supply chain. Celebrate wins like LEED green certifications for your data centers, etcetera.
- Compliance and regulations metrics to share compliance audit results, the number of data & regulatory compliance requirements met, the number of data breaches & compliance violations, etcetera.
2. Team KPIs — Developer Productivity, Developer Experience (DX), and More!
In your Slide 6, share the team & developer coding experience-focused metrics, such as:
- Active Contributors count who are committing to the code base. This reflects effective human talent utilization & engagement. The higher, the better.
- Developer Coding Days is a measure of how active are developers on average. Ideally, it should be 100% for a flawless engineering process & culture. Low coding days expose process or engineering inefficiency. And that means, there is a scope of optimization where costs could be saved, or developer experience could be improved. If it is high, it is awesome. Else, share with the board the reason, the strategy, and the investment needed to improve this.
- Code churn (the same as above), if high, could be a signal for inefficient coding skills or process inefficiencies like requirement gathering. This results in poor developer productivity and spoils the developer experience (DX), hence hitting the bottom line negatively. You should have an idea of the possible reasons, and how to mitigate them.
- Pickup time, active reviewers average, reviewer reaction time, submitter response time, involvement, and other code review-related metrics are measured to demonstrate how well the code review process is implemented in the organization, across project verticals. Explain how adherence to the ideal numbers for these metrics means an improved developer experience, and high-quality code yield, and also contributes to higher maker time. Thus, positively influencing the bottom line by reducing the costs of dealing with technical debt, and employee churn.
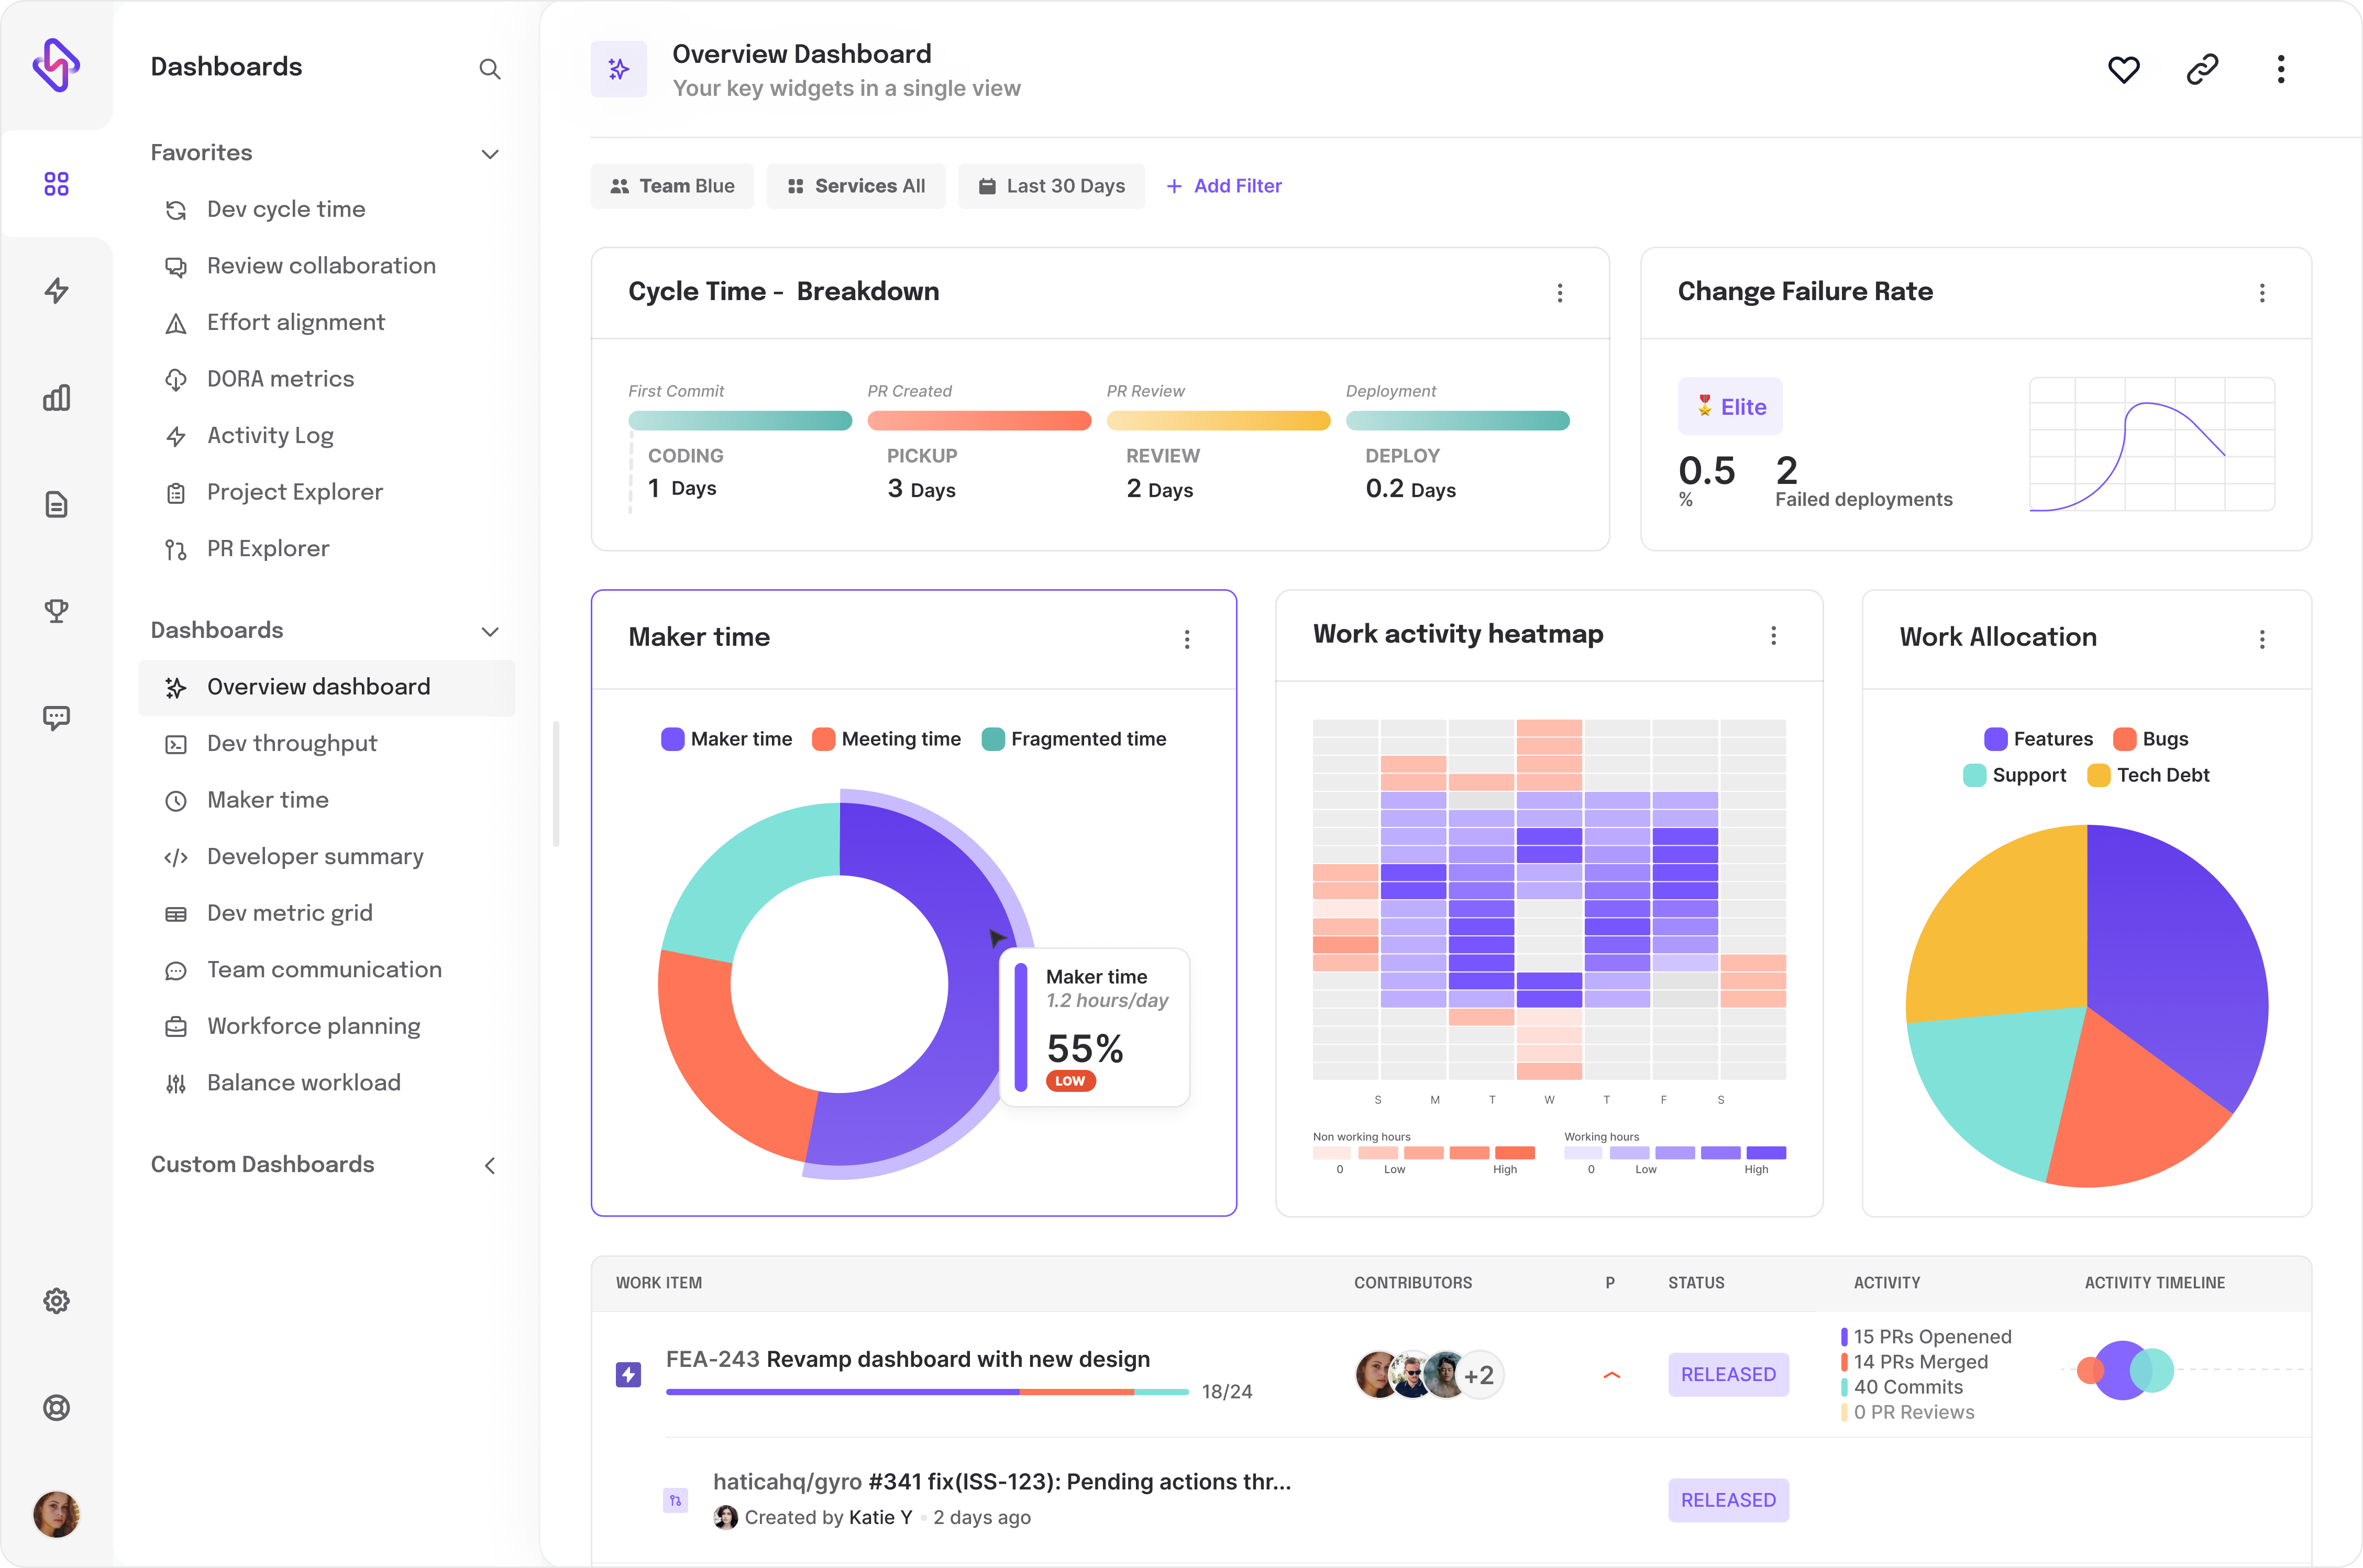
- Maker time could be the highlight of this slide as it tells what percentage of uninterrupted time a developer gets on average to actually do the coding. A high maker time positively impacts metrics like PR throughput per contributor, Lines of Code (LoC), coding time average, coding days, and code review metrics. It won’t be an exaggeration to say, the higher the maker time, the better the developer experience.
Read why you as a CTO should be championing investing in a better developer experience for your board of directors.
- A low code churn (explained above) may mean improved prowess of engineering talent. So, you can put that as well in this slide.
- Besides, you can talk about the percentage of talent who participated in tech training programs to upskill and share metrics about tech talent retention. These too reflect a well-engaged culture, which is a sign of good developer experience.
3. Market Dynamics & the Current Landscape of the Industry
Slide 7 should give a quick overview of:
- What’s buzzing in the industry?
- Competitor research insights
- Future of technical landscape in your industry, and basically noteworthy emerging technologies from the Gartner hype cycle.
- New Feature/Product Introductions to match the paradigm shift
This helps stakeholders & board of directors to grasp a good understanding of where the industry is headed. You may take the help of a VP, EM, or tech lead to prepare this slide. Salespeople may also come in handy. This is a good exercise to nurture the next generation of internal leaders and to be a floor leader even as a CTO.
Slide 8 should be about Where do you stand — your tech stack, talent pool, training programs, etcetera
Based on what you’ve included in the industry landscape slide 7, help the board of directors to:
- Take a peek into your current organization tech stack
- Understand how prepared you are technically for the future, and the strategy for tackling any anticipated or unexpected disruption, or tapping the emerging market opportunity.
4. Innovation & Research — Your Tech Radar
Slide 9 should be a continuation of your last slide. Here, you can talk about:
- Your initiatives targeted at growth, adaptability, innovation, and disruption. Like ThoughtWorks, you can share your own tech radar, where you show your prowess in different technologies, and what you plan to adopt in the future.
- Also, you can share the number of patents filed, intellectual property assets created by the team, open source leadership, etcetera.
5. Budget & Resource Allocation — The Sweet Spot of CFOs, and CEOs
Slide 10:
- Lastly, take the help of your VPs from different engineering departments or geographies, and prepare a slide where you could demonstrate how you’ve been allocating financial resources and its ROI.
- Also, advocate for new investment opportunities for improving engineering outcomes.
- Find a balance of investments, and allocation with your CFO– building quality products without offshoot budgets. One way to do so is via capitalizing some of your R&D costs. Keep your finance team in the loop about presenting capitalized vs non-capitalized expenses, and how they impacted the overall development costs. It’s one way to shoot two stones with one arrow: Free up budgetary considerations for your engineering team, while keeping the C-suite, and board members happy, and enrolled.
Slide 11: Feel free to conclude the presentation on hope with announcements of major upcoming launches, and/or small celebratory news, and/or by highlighting the major positive takeaways from the presentation. Or the best, applaud some of the emerging engineering talents within the organization.
Building a Strong Engineering Narrative for the Board
Putting up a deck could be very challenging, especially for a CTO, as you’ve no time for it. But you can work with engineering managers & VPs who could help you with it. If you’re using Hatica, then it’s almost a cakewalk, as it tracks almost 90% of the metrics you would need for the decks. Almost all the engineering efficiency metrics that you would need to present in the board meeting as a CTO can be easily collected from the Hatica dashboard. In fact, you would get ready-made aesthetic charts to include in your board meeting presentation deck.
Besides,
Hatica is a gift for every engineering team to get unprecedented visibility into engineering processes & operations. It helps in unlocking developer productivity and delivering enchanting developer experiences (DX). Book a demo to see why 20k+ engineers are using Hatica for driving engineering excellence. Also, if you do not want to miss out on more engineering insights, subscribe to our blog.


