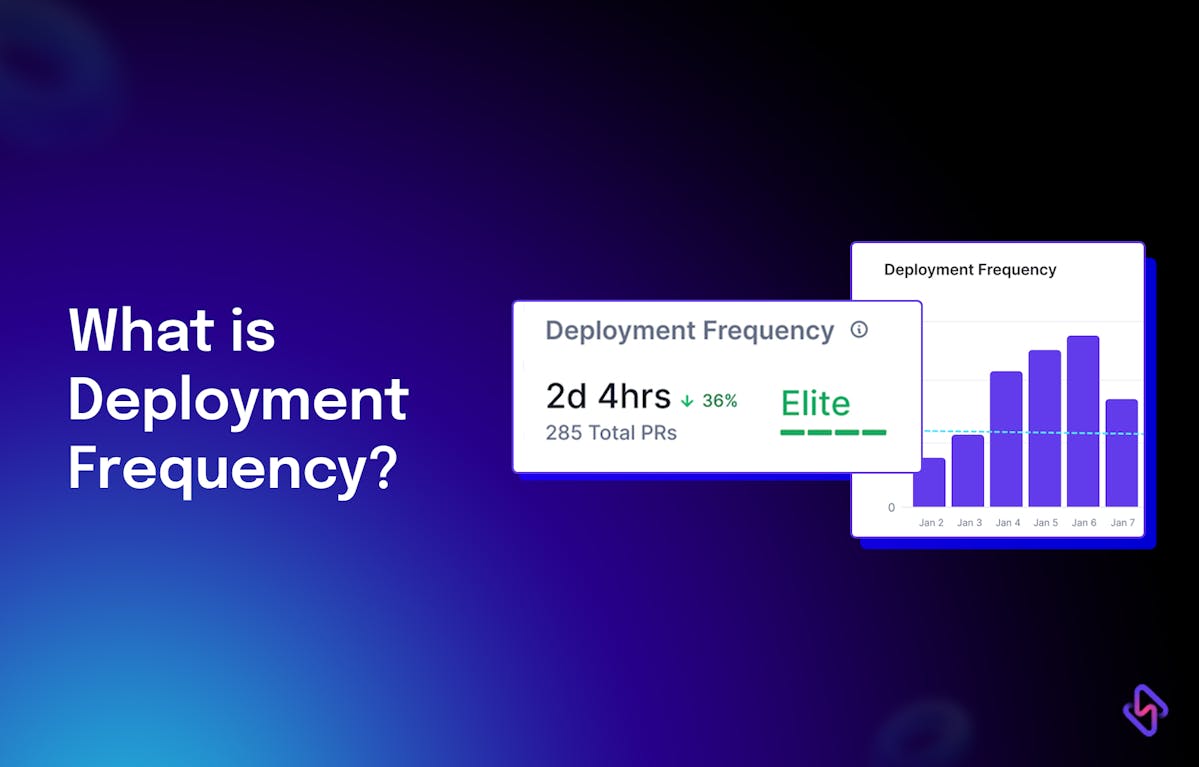
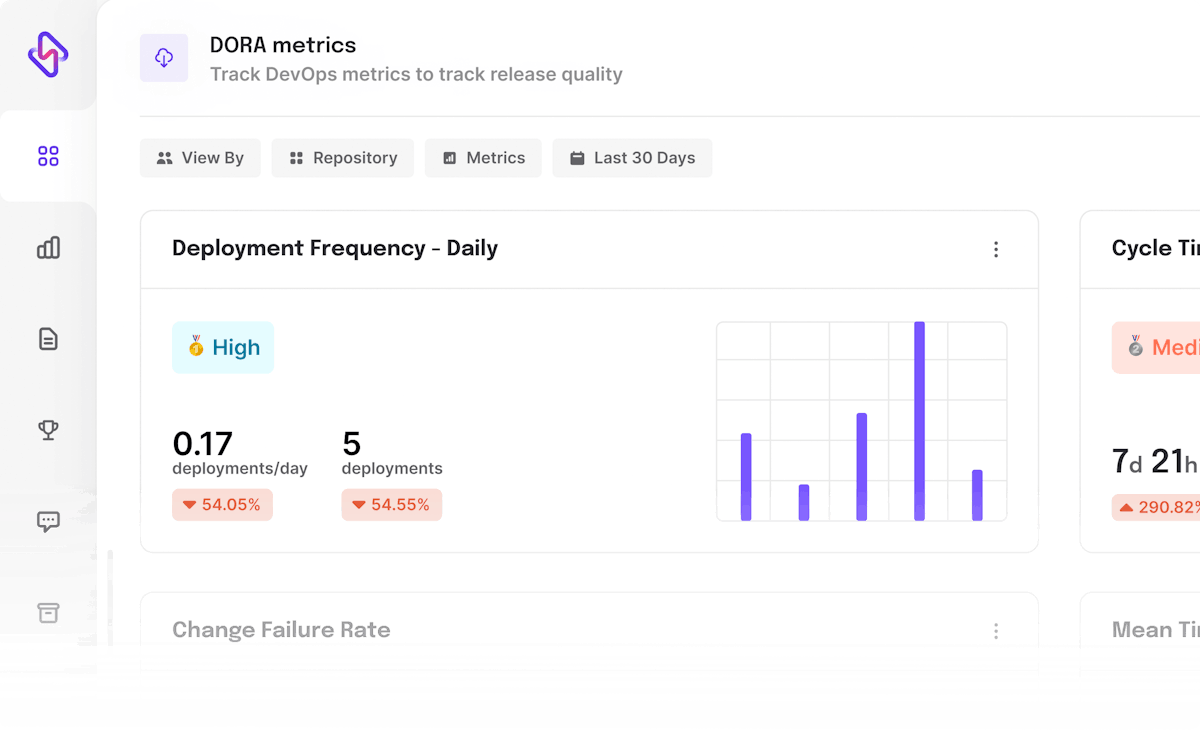
75% of tech leaders rely on deployment frequency as their measure of DevOps success. Deployment frequency is one of the key value stream metrics, and of course, one of the core DORA metrics to benchmark your software delivery efficiency.
In general, engineering managers & practitioners use all 4 DORA metrics to assess the efficiency of their SDLC processes and engineering practices.
But Deployment Frequency (75%) is by far the most tracked engineering metric compared to Mean Time To Recovery (55%), Lead Time (53%), and Change Failure Rate (48%).
Read this insight to find out-
- What is deployment frequency?
- Should you measure deployment frequency to benchmark your DevOps performance? If yes, then how do you measure deployment frequency?
- How can you improve deployment frequency if you want to?
What is Deployment Frequency (DF)?
In simple terms, Deployment Frequency is the count of ‘how many times you deploy code to production in a given time frame’.
Okay. That’s simple, but not clear. Doesn’t it sound vague and a little cryptic?
For a more descriptive & vivid definition of deployment frequency, it’s important to understand what qualifies as a successful deployment.
In an org that has embraced DevOps practices, here’s how the code gets deployed to production-
- A developer or team pushes the code to the repository i.e., raises a PR (Pull request). The PR gets subjected to all sorts of SDLC processes— code review, functionality testing, etc. It’s recommended to follow the PR best practices.
- Continuous Integration (CI) server detects the code changes in the repository and triggers automated build & testing processes.
- The code gets compiled into executable binaries/artifacts (for example - docker images for containerized applications).
- The software application artifact is then pushed to the staging environment where automated tests are carried out, and the QA team validates the new artifact’s performance, security, and functional aspects.
- If critical bugs or issues are identified in the QA process, the developers are requested to fix them. If not, the artifacts are in a production-ready state and enter the deployment pipeline.
- The deployment pipeline provisions pre-production or the production environment using GitOps— IaC scripts, and the defined deployment process (Canary-releases, Blue-green, Shadow, Rolling, A/B Testing, etcetera). Ideally, it’s a good practice to test all aspects of software applications in a pre-production environment for improved software reliability.
- At last, the artifacts get deployed to multiple servers & regions to reduce redundancy. After all, multi-cloud DevOps is the new norm.
- Thereafter, the monitoring, logging & alert systems get into action to detect any anomalies in the software performance, and trigger alerts to the concerned teams for timely troubleshooting the issues & lowering the risks.
- If everything goes well, it is considered a successful deployment.
- Else, if there are critical incidents, performance loopholes, outages, or security risks, often the deployment is rolled back, reverting to the last working artifact. Such deployments don’t qualify as successful.
Now, many engineering leaders calculate total deployments (successful or unsuccessful) in a given time frame as deployment frequency. Some exclude rollbacks and consider only successfully deployed artifacts to calculate deployment frequency.
But what’s the right approach to measuring deployment frequency? Wouldn’t considering unsuccessful deployment artifacts to calculate deployment frequency skew the performance report and paint a misleading narrative? What is the point if the deployment frequency DORA metric is way too good, but the business KPIs are bathing in red?
Well, keep reading and we shall figure that out. But a pertaining question at the moment is whether we should measure deployment frequency at all.
Why Is Deployment Frequency Important?
The benefits of measuring deployment frequency transcends beyond gauging software delivery speed or operational efficiency. When used right, it not only helps you enhance the overall SDLC processes but also improves business outcomes-
Deployment frequency facilitates agility, adaptability, and quick value delivery
High deployment frequency, with the right engineering practices in place (rigorous testing, and code reviews) would mean feedback-driven rapid value delivery to end users through iterative software development cycles.
Again, the gambit here is that an increase in deployment frequency shouldn’t deteriorate reliability metrics.
- MTTF- how long software systems operate without failing, MTBF- the average time between system failure, System Uptime, Error Recovery Rate, and Test Success Rate shouldn’t decrease with an increase in deployment frequency.
- Similarly, Failure Density, MTTR - how long it takes to fix system failures, Incident Rate, and Open Tickets metrics shouldn’t spike up.
1. Deployment Frequency Helps in Effective Risk Mitigation
High deployment frequency, could also mean quick roll-out of security patches, and bug fixes, and thus help in timely mitigation of software vulnerabilities. The lower the batch sizes, the higher the deployment frequency. Hence, it is easily manageable.
Continuous deployments mean rapid feedback from end customers. Thus, issues can be detected in almost real-time. You can pinpoint specific deployments that might have triggered the problem. And developers too can work on it effectively, as they might have the context fresh in their memory.
This is not possible in case of large and infrequent deployments i.e., low deployment frequency, where you identify issues after weeks of time, and probably the developers would have lost the context, and may even have switched teams or companies (thanks to the great resignation waves).
2. Deployment Frequency Can Help Improve Business KPIs
Frequent deployments, feedback-driven rapid value delivery, quick issue remediation, etcetera enhance the overall user experience.
It also improves the innovation quotient of your organization and helps you capture a larger share of the market.
Besides, continuous shipping of new features to the screens in the hand not only delights users, but also improves user engagement, brand perception, and customer loyalty. And of course, improved user satisfaction is followed by more business and higher revenue.
Should You Measure Deployment Frequency to Benchmark Your DevOps Performance?
If utilized right, deployment frequency does allow you to gain greater visibility into your engineering processes. It helps you assess how efficiently & effectively you develop, deliver, and operate software applications.
But you can’t rely on deployment frequency as a sole engineering performance metric.
- You need to look at it in tandem with other software delivery metrics to evaluate your DevOps performance & engineering efficiency.
- And then, as highlighted in Google’s State of DevOps 2022 report, you also need to map DevOps performance metrics (esp deployment frequency) to the bottom line and see how it impacts the operational performance i.e., reliability, and subsequently organizational performance i.e., better user experience, upsells, revenue breaching the highs, etcetera.
The same report says-
“We have evidence that suggests that delivery performance can be detrimental to organizational performance if not paired with strong operational performance”.
So, a sensible approach would be to definitely consider deployment frequency to assess your engineering efficiency, but you must also factor in the engineering metrics that reflect software reliability—
- Mean Time To Failure (MTTF)
- Mean Time Between Failures (MTBF)
- Mean Time To Repair (MTTR)
- System Uptime
- Failure Density
- Error/Incident Rate
- Error Recovery Rate
- Code Coverage
- Test Success Rate
- Failover Time
- Open Tickets (issues), etcetera.
The goal is to find the right balance between software reliability metrics & deployment frequency. It’s about both— speed & quality.
How to Measure Deployment Frequency?
Now, we understand that measuring software delivery metrics is not to do gorilla-style chest-thumping or boasting about high deployment frequency, but to improve your overall engineering health and business outcomes. So, it doesn’t make sense to include rollbacks in calculating deployment frequency. Ideally, you should only include successful deployments while measuring deployment frequency.
A question that emanates is how to measure deployment frequency. Should it be done manually? Or, are there tools to measure deployment frequency?
Well, you can manually count the number of successful deployments by delving into the logs history of your CI/CD tools. Divide it by the number of days, weeks, or months depending on how you’re calculating deployment frequency.
But it is only feasible for a very small team of developers. And it is NOT RECOMMENDED. Yes, in bold & caps. Because then there are high chance that bias will be introduced for obvious incentives. Besides, manually you can’t measure and map deployment frequency to other software delivery & reliability metrics.
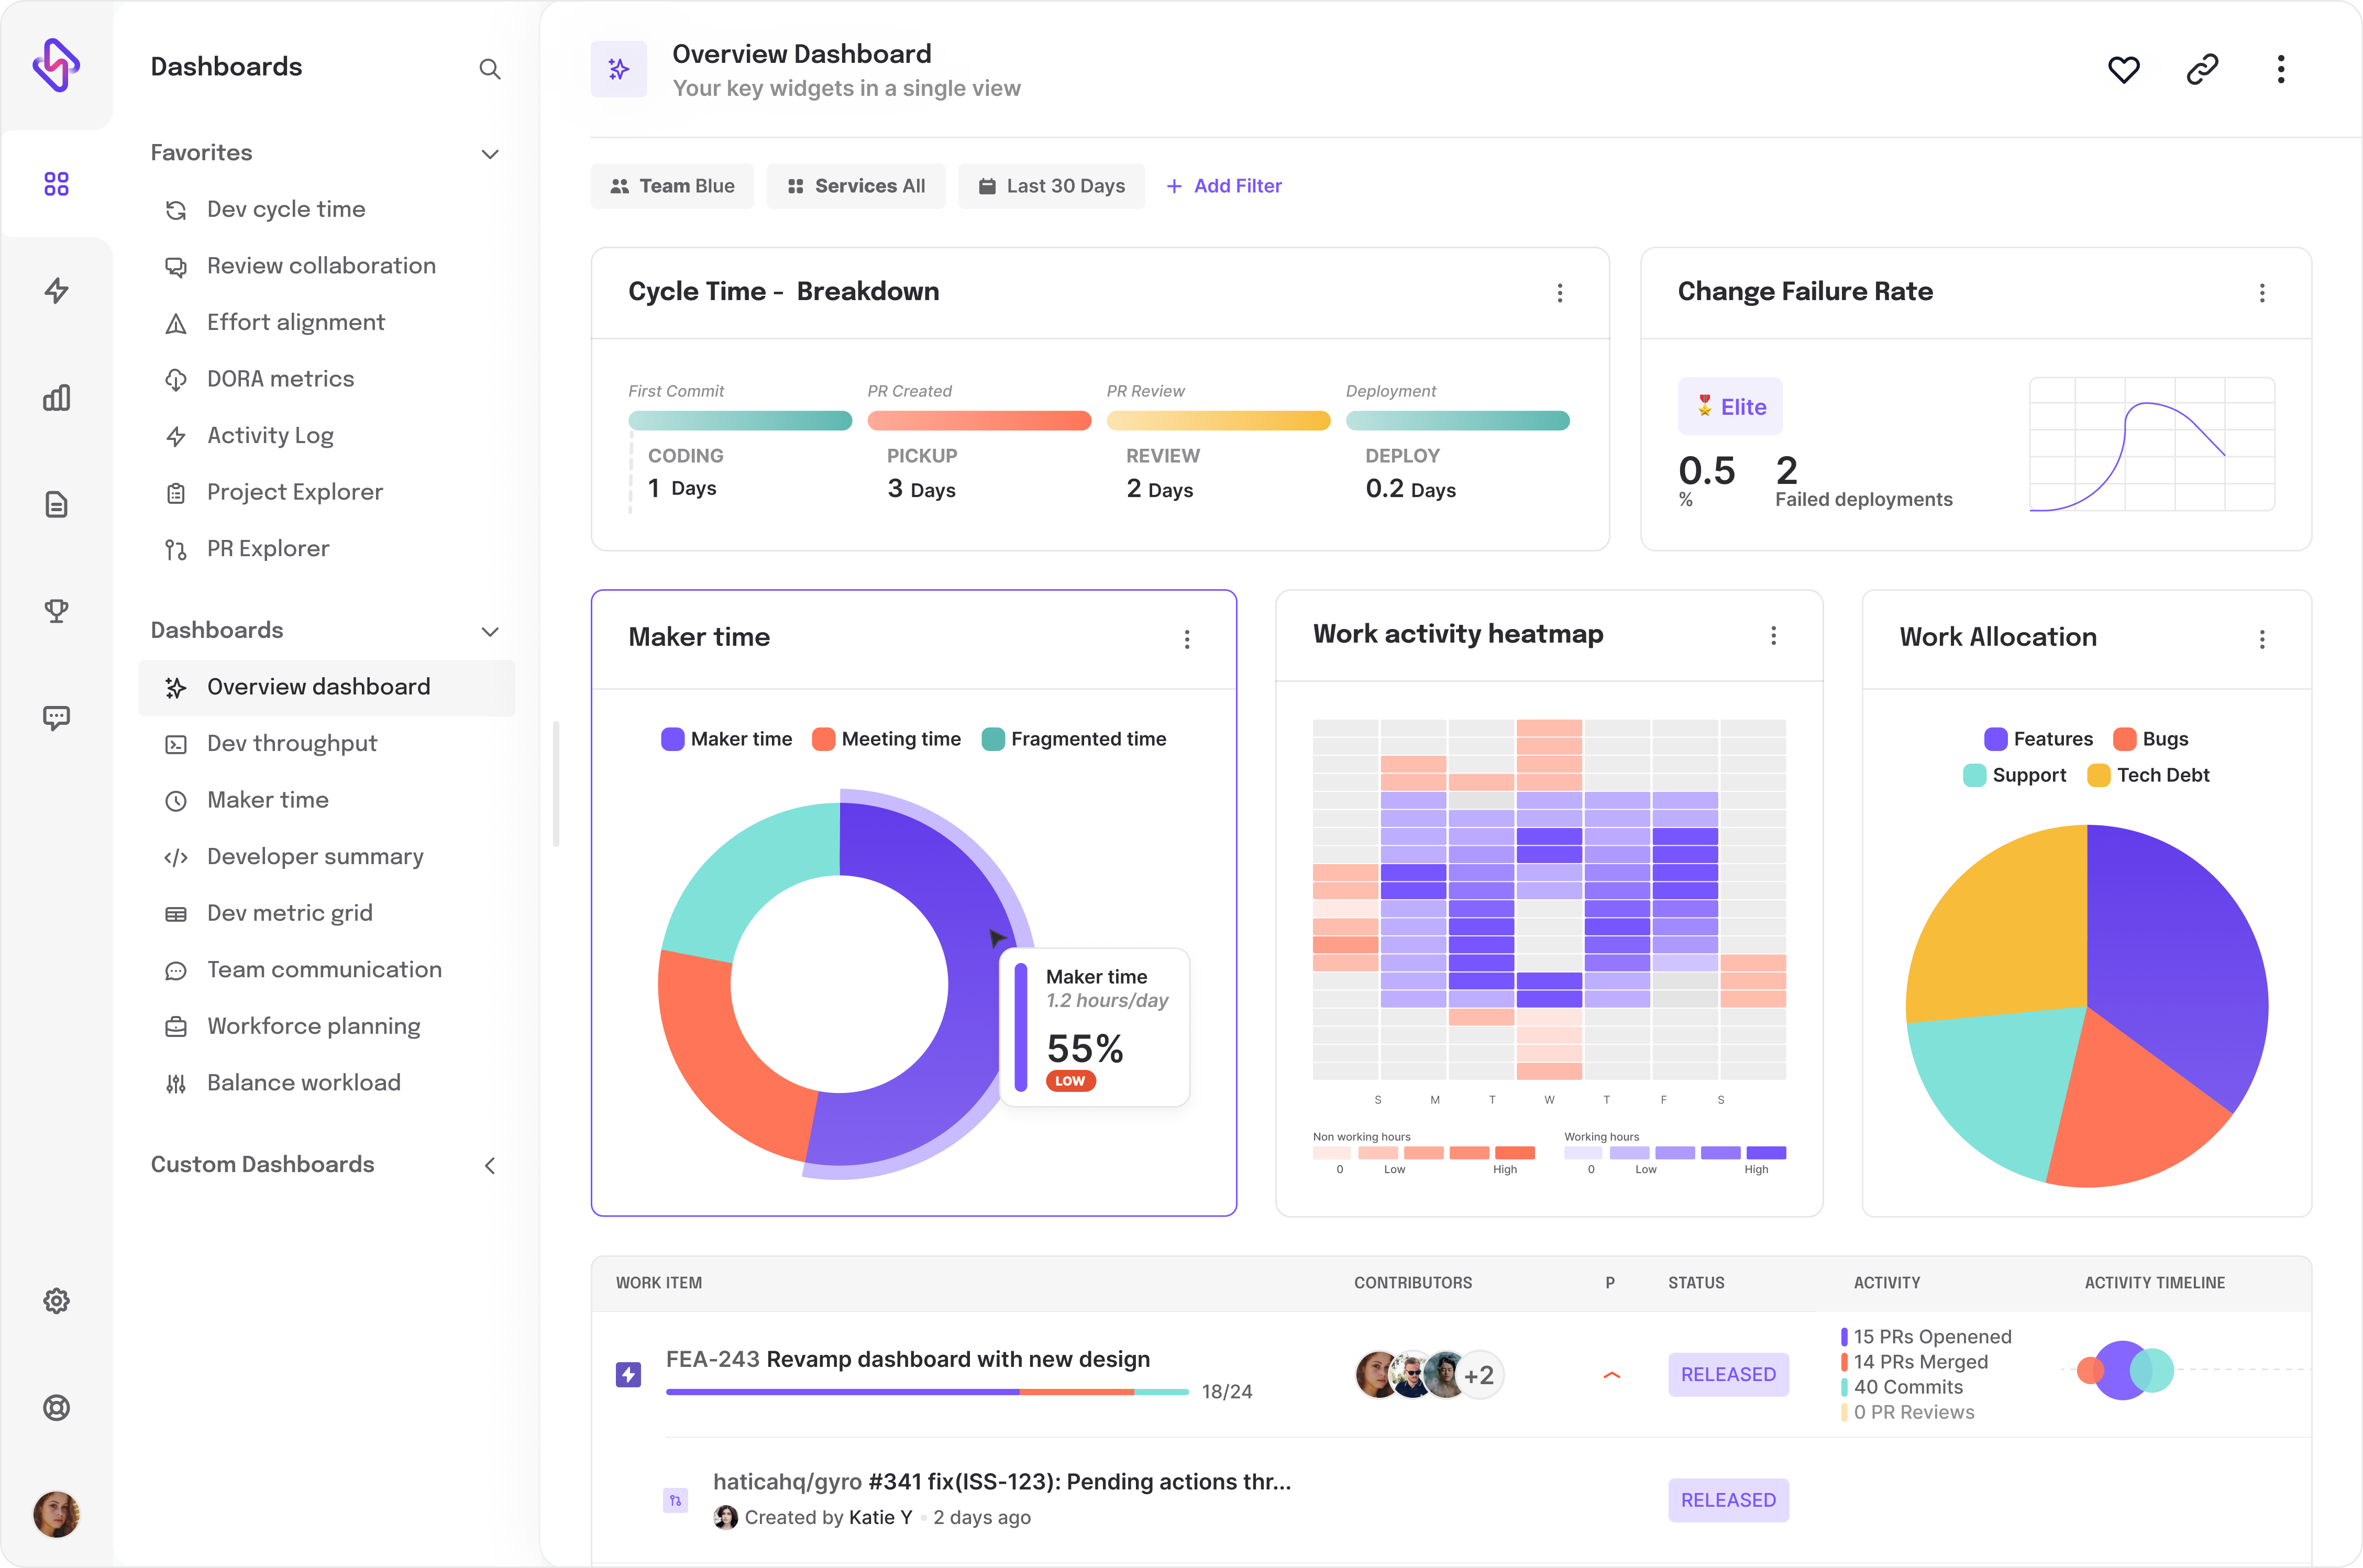
A better alternative is to use an engineering analytics tool (say ‘Hi’ to Hatica). Hatica is an engineering analytics tool that integrates well with your existing SDLC tech stack, aka toolchain and helps you gain complete visibility into your engineering processes by tracking 130+ engineering KPIs & metrics.
Hatica not only helps you gain insights into your engineering health but also enables you to optimize your processes for enhanced developer well-being by enabling you to keep a tab on developer experience (DevEx) metrics like developer burnout, coding days, maker time, etcetera.
Anyway, here’s how ideally deployment frequency gets calculated automatically using Hatica.
- Hatica integrates with your CI/CD tool chain to track events like code commits, build initiations, testing, and deployments. This can be done using ping, and poll mechanisms for event tracking.
- The deployment data is recorded in real-time, and based on how you configure it, deployment frequency is calculated. It is computed by dividing the total count of deployments by the time interval i.e., a week or a month.
- Next, the result gets sanitized by normalizing it against various variables like the number of working days in a week/month, unsuccessful deployments & rollbacks, deployments that resulted in service degradation, etcetera. Normalization is possible, because, as stated earlier, Hatica tracks 130+ engineering metrics. Without normalization, you would be often left with skewed information, aka data noise.
- Additionally, Hatica also helps you collate the deployment frequency of specific development teams distributed across business verticals and geographical regions. This helps you further understand & improve the efficiency of your engineering teams at a granular level.


