Hatica v3: Closing the Loop on Driving Engineering Productivity

We're thrilled to introduce Hatica v3! Dive into our latest blog to discover our redesigned navigation and enhanced dashboards, providing engineering teams improved visibility and deeper insights at team, project, and org levels.
Hatica v3: Closing the Loop on Driving Engineering Productivity

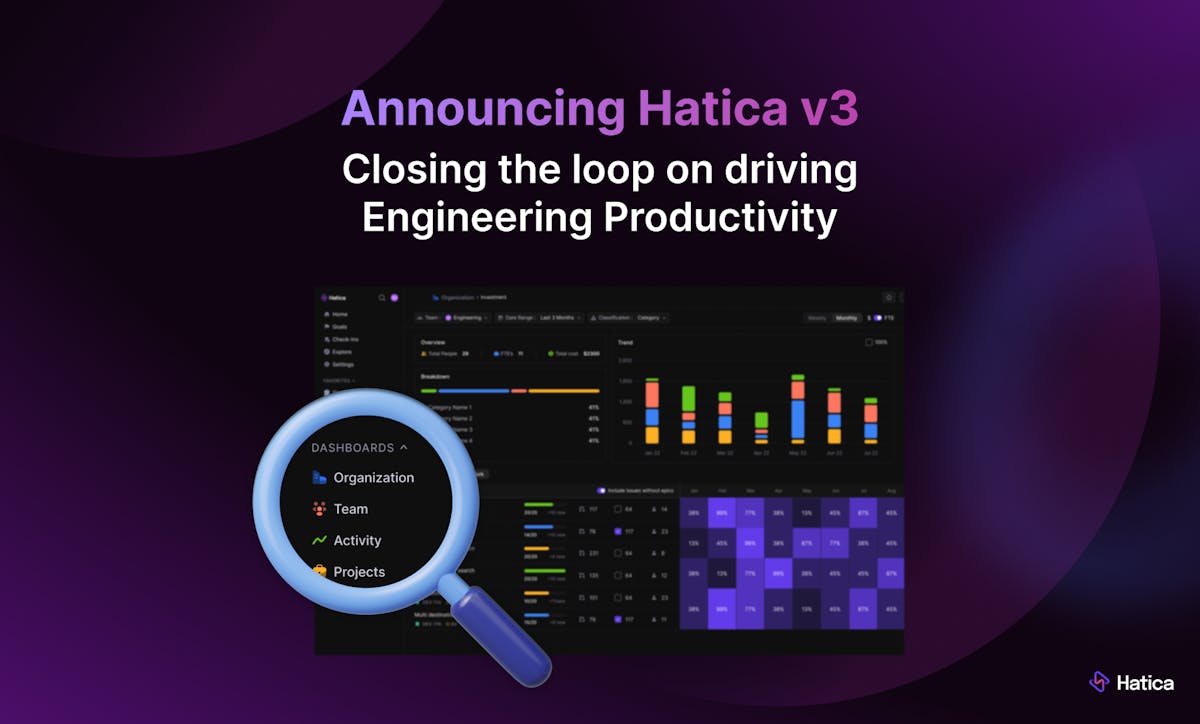
Today is a big day for Hatica. Three years ago, Hatica started as a small team with a big dream – to help engineering teams leverage data to be more productive and efficient. Since Day 1, we have been working hard to figure out ways for data to be more easily accessible, meaningful, actionable, and not counter-productive for engineering teams. And we're thrilled to announce the launch of Hatica v3 which is one step ahead in the direction of building advanced Engineering Management Platforms for modern-day engineering teams. 

Hatica v3 brings a fresh approach to EMP with advanced analytics. It helps you see the big picture, monitor and measure developer productivity at individual, team, and project levels, set goals, and improve your overall engineering operations thereby establishing a constructive feedback loop for engineering teams.

Our advanced engineering analytics allow you to go beyond surface-level metrics and dive deep into the core of your engineering processes. By providing a holistic view, Hatica v3 enables you to identify patterns, uncover insights, and make data-driven decisions that drive real improvement.
With the Hatica v3 release, we are ensuring that the data doesn’t consume you rather you can consume data hassle-free with ease to drive engineering excellence within your teams. This update reflects our dedication to creating an advanced engineering management platform, with a focus on stitching together the four pillars of engineering productivity: team alignment, delivery velocity, software code quality, and developer experience. 

Let’s dive deep into what Hatica v3 brings to the table. 

We Listened to You!

Hatica v3 is built on the feedback from our customers, prospects, and engineering leaders. After speaking with 100s of tech leaders, innovators, and engineering managers we realized data availability alone is not the problem but how easy it is to access data, what meaningful actionable can be derived from that data, and how it impacts each individual in the engineering team matters as much. Hatica v3 is a huge leap towards bridging these gaps for engineering teams that are looking for reliable data to steer success!

We know data is only helpful when it tells a story. That's why Hatica v3 goes beyond plain numbers and vanilla navigation – it connects the dots, highlighting interconnectedness between various metrics (and indicators) giving you clear insights to make smarter decisions.

Every click inside the Hatica platform - with Hatica v3- delves into deeper insights unleashing information that otherwise would have always remained hidden and unfound.

Here at Hatica, we focus on four key pillars to help your engineering team succeed: Alignment, Velocity, Quality, and Developer Experience. These together are the cornerstones of our philosophy behind bringing this release to reality. This helps us map every single data point to its rightful place across the SDLC, identify what the actual pain point or blocker is, spend time and effort fixing the right things, and get you closer to your goals. 


In our conversation with engineering leaders, we asked them specific questions, and observed their working styles and how they run their engineering teams in order to understand:

  • How are their engineering teams structured? 
  • What are the key engineering metrics or KPIs that are quintessential to them?
  • How much data is available to them and how easily can it be accessed?
  • Are you able to find and navigate the data you mostly need?
  • How meaningful and actionable is that data?

After having talked to so many of them, we could identify the following:

  • Data accessibility is one of the key challenges. Most engineering leaders struggle to find the right data at the right time
  • A poorly designed productivity tool prevents them from navigating between dashboards and obtaining relevant insights.
  • Broken user journeys limit data exploration beyond a certain point thereby diminishing the use of data
  • Lack of guidance on translating metrics into actionable steps for improvement.

Ultimately, how can we ensure that engineering teams and leaders can leverage data to the best of their use in their day-to-day work and long-term planning? This is where Hatica v3 pitches in. 

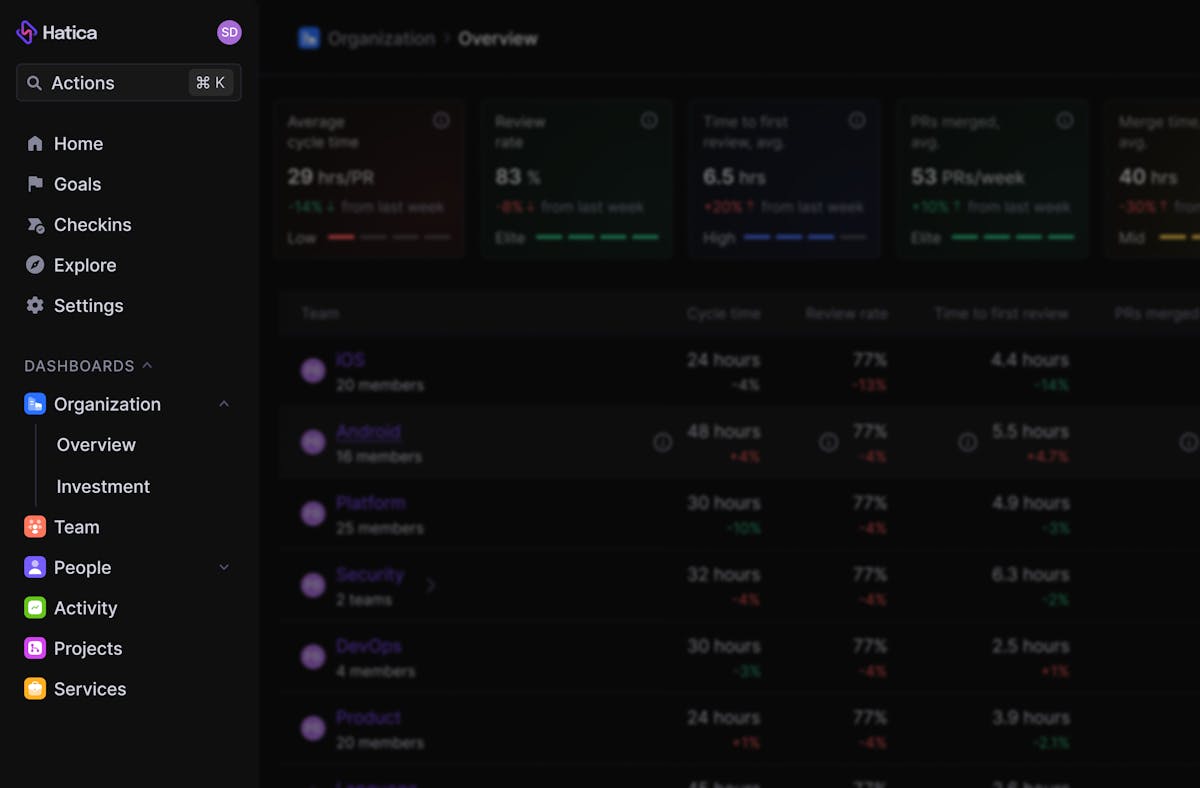
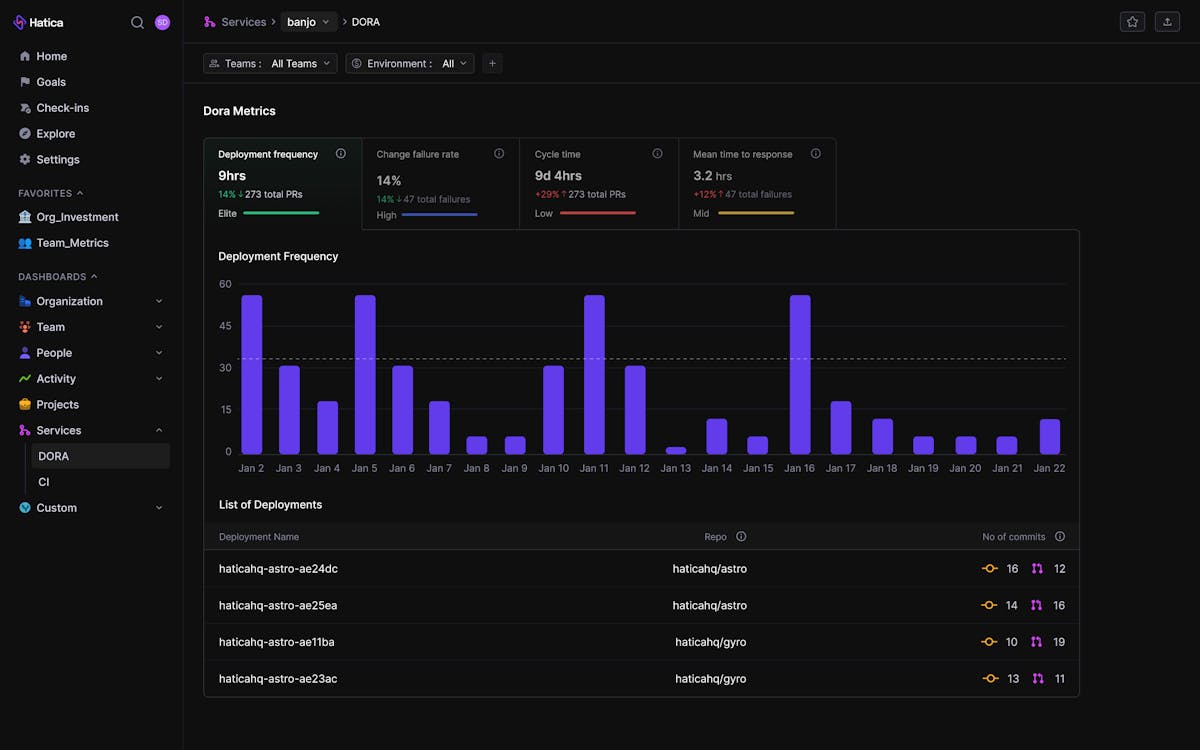
Finding the right information shouldn't be hard. With Hatica v3, we've made navigation simpler and more logical. Dashboards are now grouped by projects, teams, and activities (more in detail later). This change makes it easier to get the insights you need quickly and efficiently.

Data That Makes Sense for Your Team

Every engineering team is unique, tackling problems in their own ways. In my experience, this is why a one-size-fits-all approach to data just doesn't work.

Hatica v3 is here to change that. With this release, we aim to democratize engineering management by simplifying adoption and increasing data utility as per the unique needs of each engineering team. 

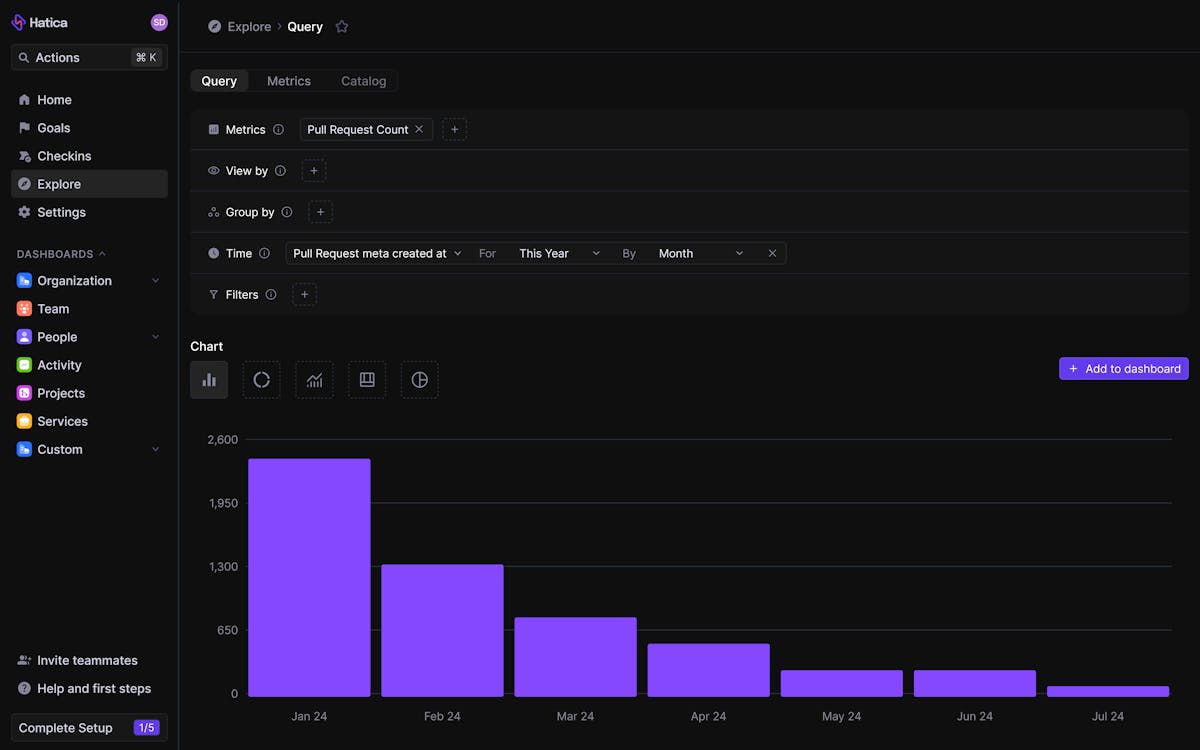
Now, you can create custom dashboards that focus on the data that matters most to your team.

Think of it as building your personalized news feed, but instead of daily headlines, it helps you identify and address gaps within your engineering team. This targeted insight drives you toward building a strong and healthy engineering team, ensuring that your team’s specific challenges are met with the right data and support.

Here's What You Get with Hatica v3:

Hatica v3 is all-new, inside and out. New look, new way to work, intelligent dashboards with more elaborate data.
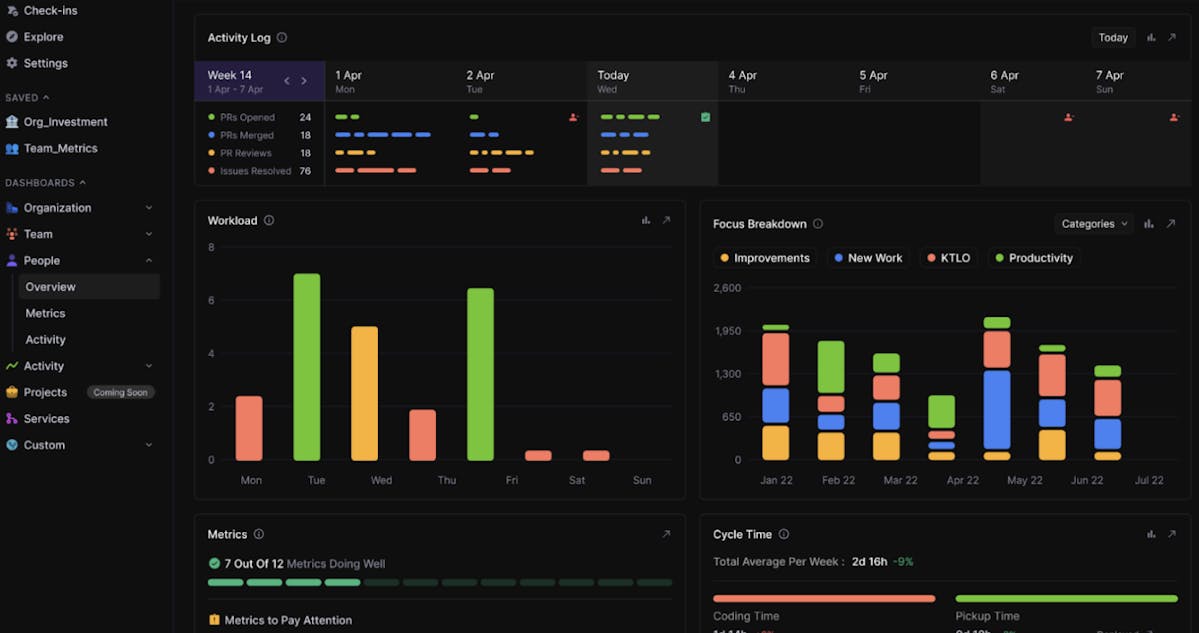
This update introduces a new way to look at your engineering metrics, and we’re excited to unveil the much-requested Dark Mode. (That’s how our users love it!) Now you can customize your view for a more comfortable and focused experience. 
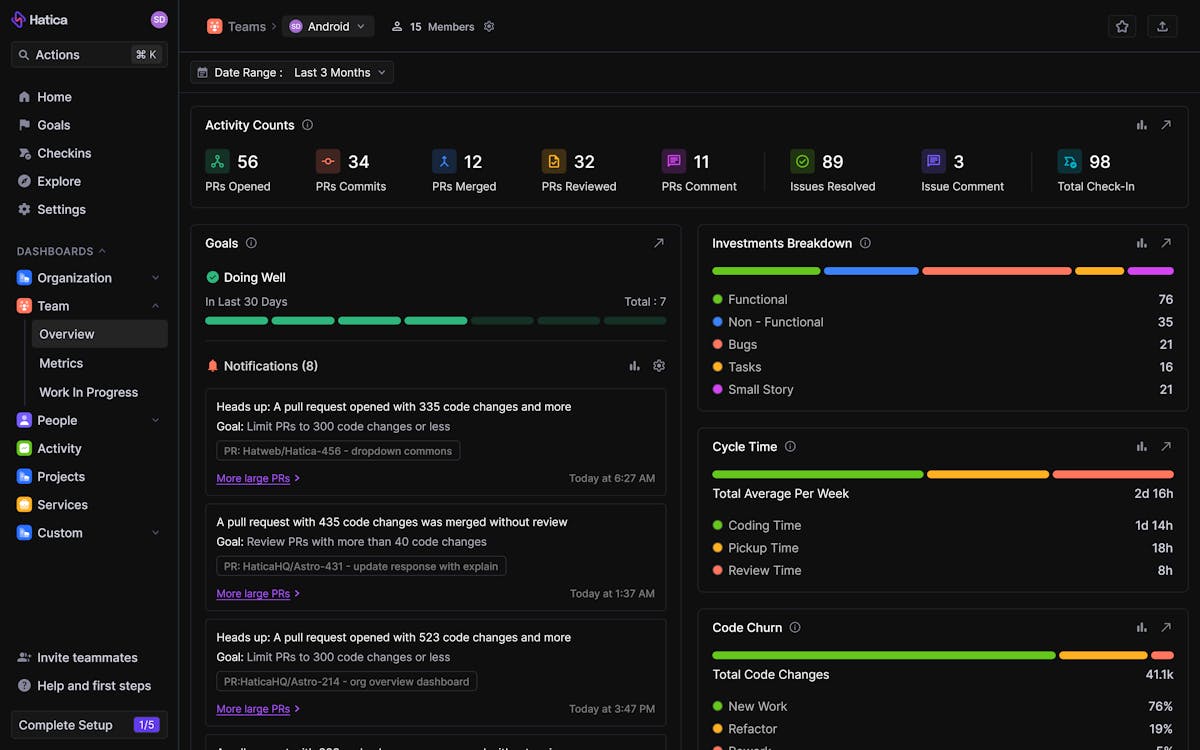
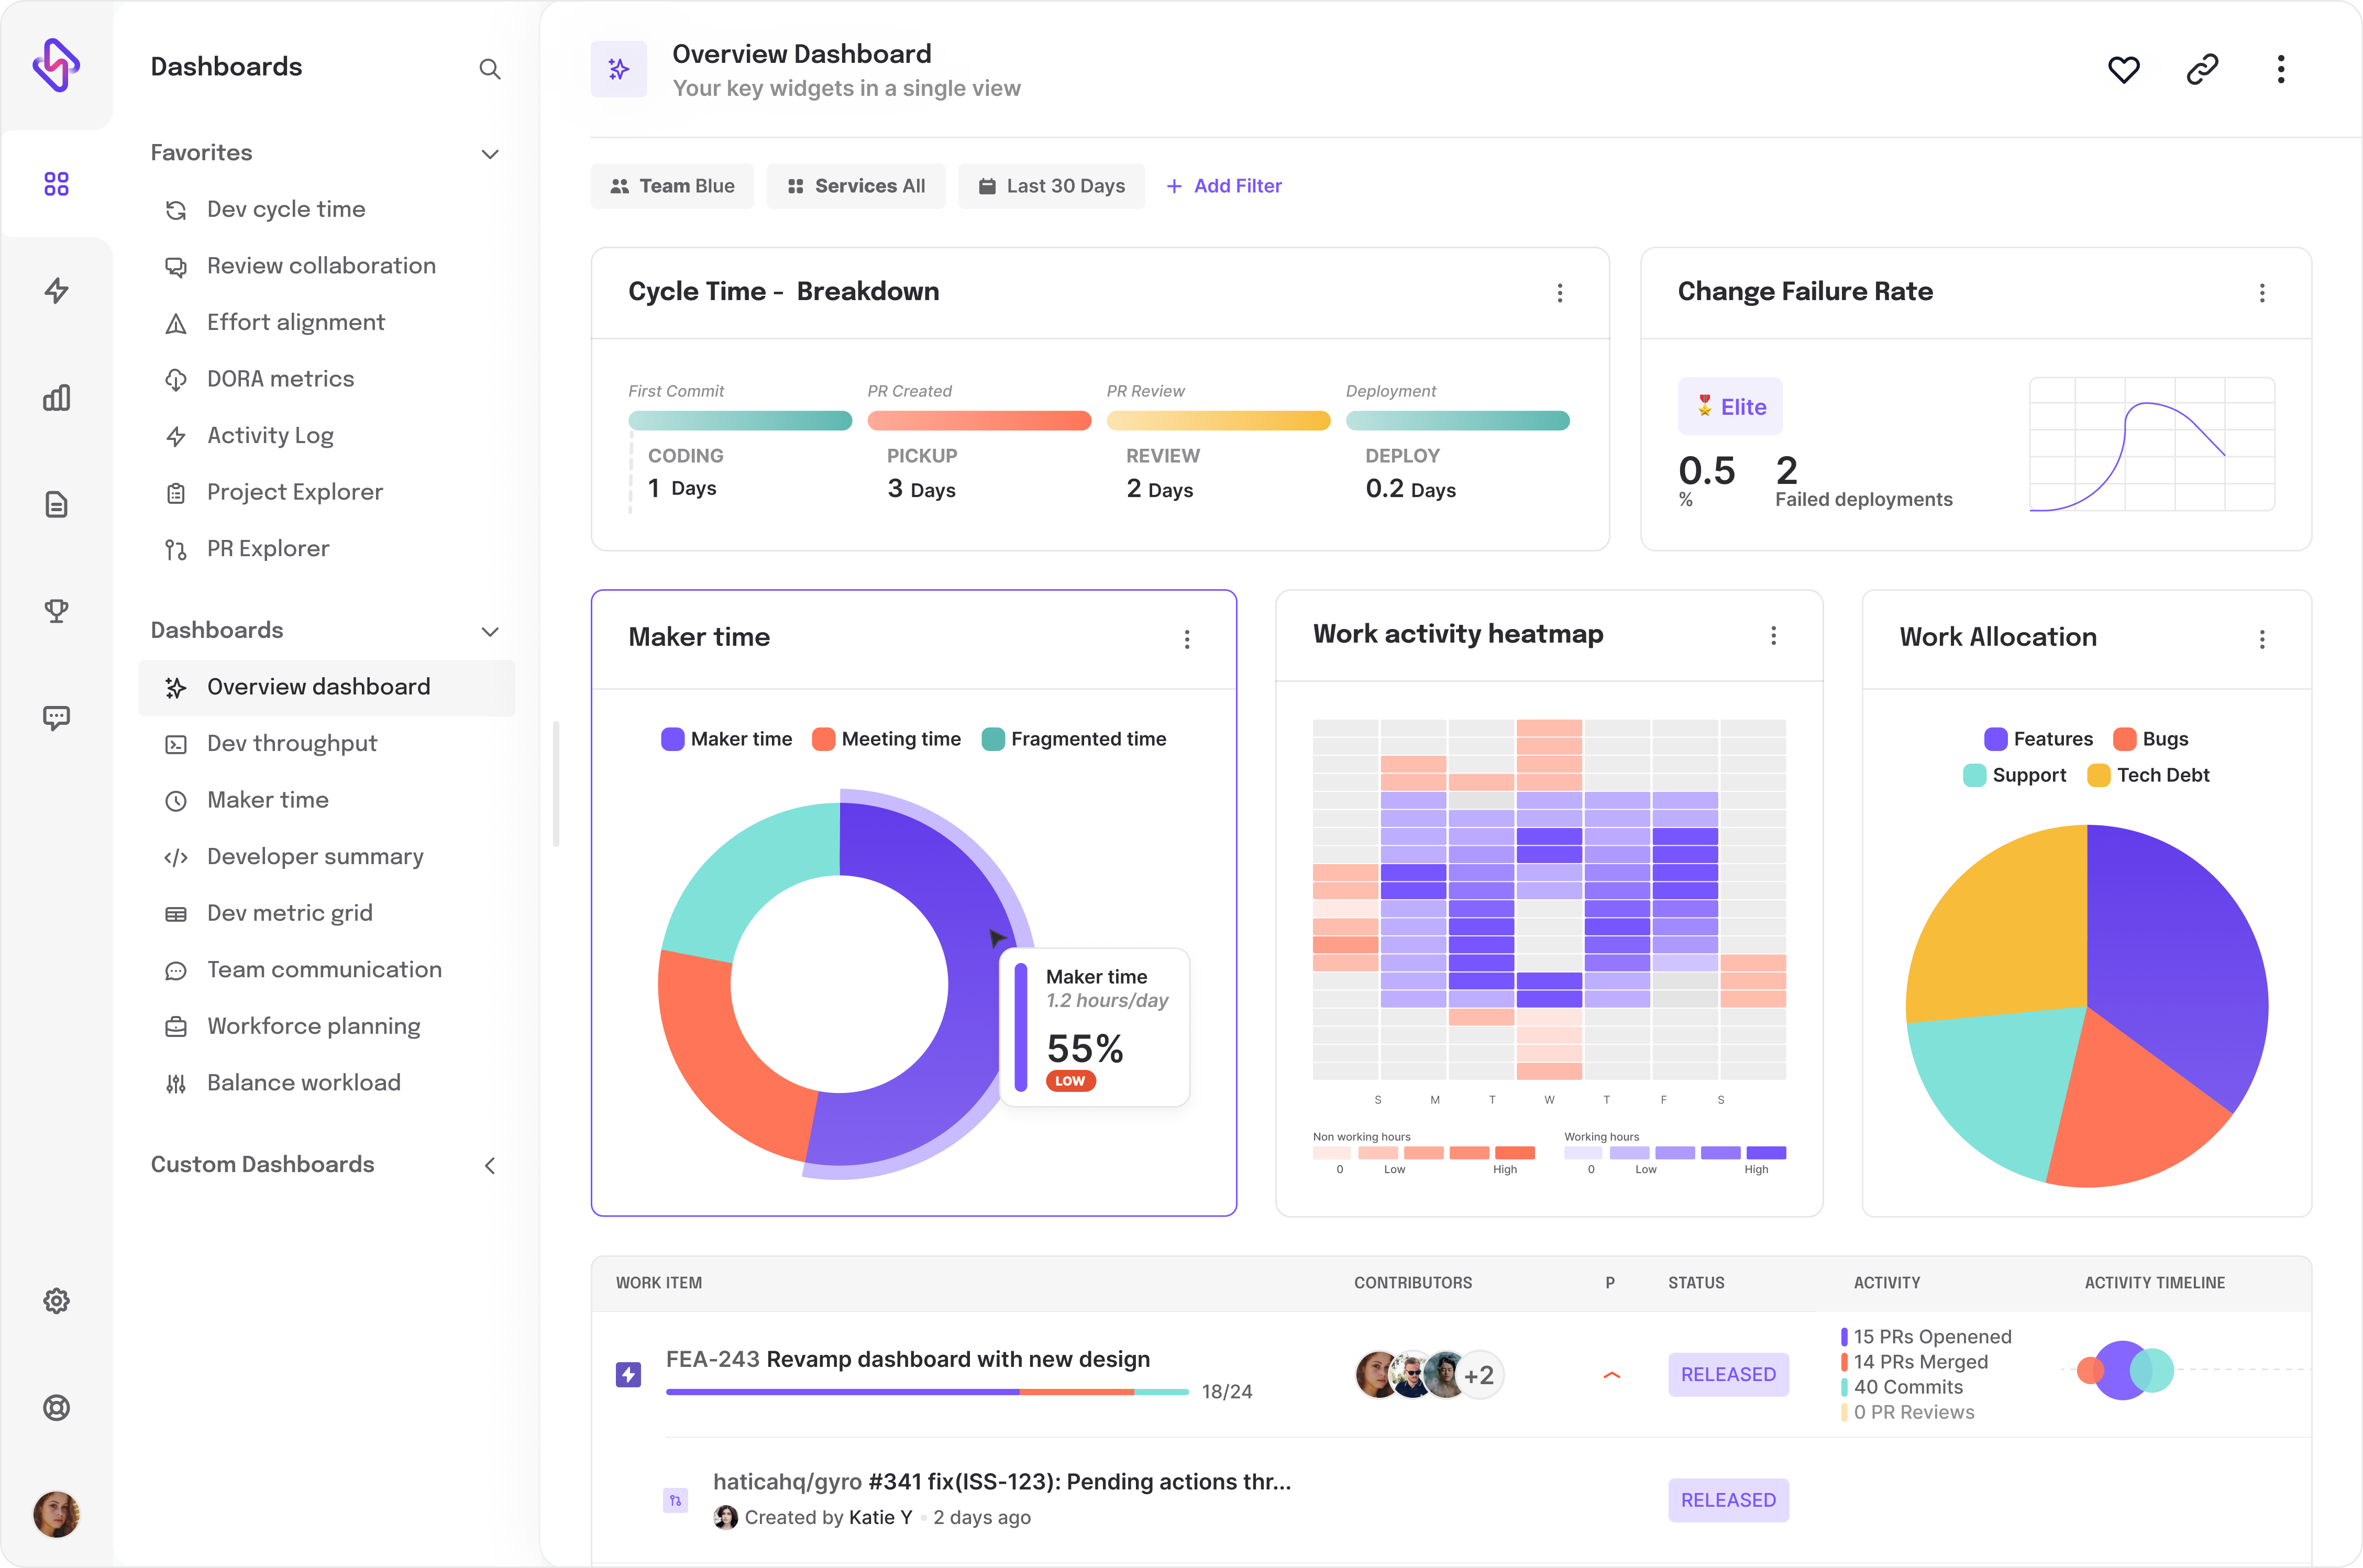
Moreover, we've improved all dashboards to be more detailed, interconnected, and packed with useful, actionable insights.

  1. Easy Navigation: See data for your entire company, individual teams, or specific projects – all in one place, with no hassle.
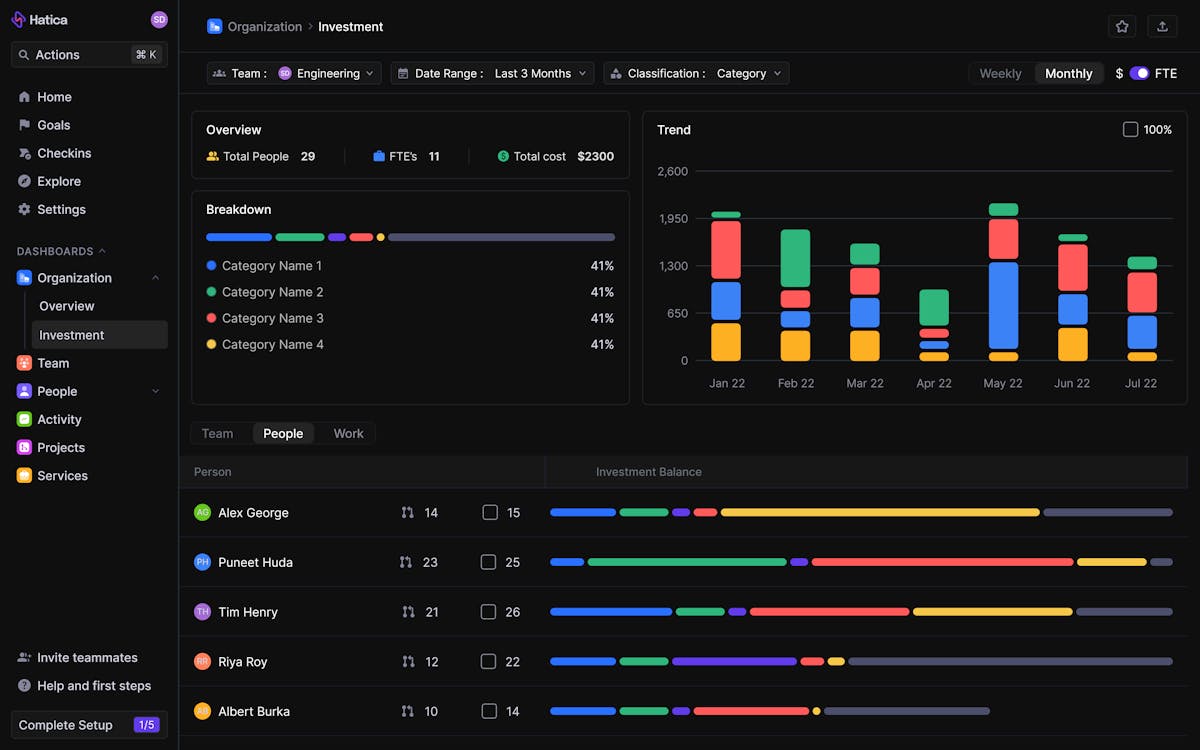
  2. Build Your Own Dashboard: Pick the data that matters most to your team and set it up how you like.
  3. Make it Yours: Set up your team structure, goals, how you categorize work, and more – all to fit how you operate.
  4. Get Helpful Hints: Hatica v3 doesn't just show you data, it helps you understand it and take action to make your team even better.
  5. Trust the Data: Every number you see in Hatica can be traced back to its source, making Hatica the one place you can trust for all your engineering team's data.

As someone guiding engineering teams and giving them direction, we constantly navigate the complexities of making the right, informed decisions. While data can help, it also tends to become overwhelming. 

Therefore, the latest update to Hatica addresses a common challenge we face: making sense of overwhelming data to drive strategic decisions effectively. Let me take you through how this update can transform your approach.

Navigation Bar - Hatica 3.0

First of all, we're redesigning Hatica's navigation sidebar to give you quick access to the most used dashboards and features. Organized by use cases, you can effortlessly navigate through organization, team, project, activity, and other dashboards

Seeing the Big Picture

Imagine managing resources across multiple projects without a clear view of how resources are allocated. Are we spreading ourselves too thin? Are we lagging behind the industry standards? 

Hatica's new Organization Dashboards provide a high-level view of the entire engineering landscape. Now, we can easily see how our budget and people are distributed, identify areas for optimization, and benchmark our performance against industry standards. This clarity helps ensure our resources are aligned for success.

Organisation Overview - Investment

Highlights:

Org Overview Dashboard: Gain a complete perspective of your organization's performance with the Org Overview Dashboard. See investment balances and key metrics, and easily make strategic, data-driven decisions with ease.

Balanced Investments: Understand how your budget and resources are allocated across projects.

Quick Metrics: Identify improvement areas with metrics benchmarked against industry standards.

Team Performance: Track team progress over time and delve into specific metrics.

Complex Structures: Monitor performance at all levels with hierarchical team views.

Supporting Developers and Teams Better

Pinpointing where individual teams need support can be like finding a needle in a haystack. 

Hatica’s Team’s Dashboard is your daily go-to for managing engineering teams. It offers a comprehensive snapshot of everything that matters, including goal progress, resource allocation, activity levels, team well-being, and more. This holistic view ensures you stay informed about your team's overall health and productivity, making it easier to address any issues promptly.

Team Overview Dashboard - Top

Additionally, Hatica's People Dashboards dive deep into individual contributions, fostering better communication and enabling data-driven performance reviews. With these insights, we can spot areas for improvement and ensure everyone is on track to achieve their goals. This targeted approach helps us support our teams more effectively. (Beware! The idea is to foster better team collaboration and offload individuals who are not able to contribute their best in the given setup. ( ⚠️ This is not a place to bossware!)

People's Dashboard - Overview

Highlights:

Daily Snapshots: The Team Overview Dashboard provides goal progress, resource allocation, and team well-being.

Activity Monitoring: Track team activities across platforms.

Goal Tracking: Identify goals needing attention and tasks requiring improvement.

Productivity Insights: View metrics like work investments, cycle time, and code churn.

Standup Participation: Monitor standup participation, mood, and blockers.

Deeper Insights: Access detailed data by clicking on any widget.

Keeping Software Delivery Smooth

Maintaining smooth software delivery is a constant challenge, with DevOps performance often hard to track. The new Services Tab provides industry-standard DevOps dashboards, making it easier to monitor and improve our software delivery process. We can identify bottlenecks early and ensure a smooth flow from ideation to deployment, keeping our projects on track and our teams productive.

DORA Metrics Dashboard - Hatica 3.0

Highlights:

Performance Metrics: Effortlessly measure and improve your software delivery performance.

Industry Standards: Utilize DORA and CI/CD Insights for accurate performance tracking.

Filters: Track DORA metrics basis specific services and teams 

Managing Data Overload

The sheer volume of data can sometimes be paralyzing, making it difficult to see what's important. Hatica's Activity Dashboards offer a bird's-eye view of all organizational activities, from code changes to team interactions. This real-time map helps us stay on top of everything, ensuring nothing gets lost in the shuffle and allowing us to focus on what truly matters.

Highlights:

Comprehensive View: Maintain a clear picture of work in progress.

Focus on Tasks: Concentrate on vital tasks and monitor progress across the board.

Customizations for Unique Needs

Every engineering organization is unique, and a one-size-fits-all approach to data doesn't work. Hatica's Explore Tab lets us build personalized dashboards with custom metrics. Woo-hoo! This flexibility empowers us to tailor our data experience to focus on what matters most to our team's success.

Custom Query Bar Chart - Hatica 3.0

Highlights:

Build Custom Queries: Use the query builder to create custom queries with Hatica metrics.

Choose Your Charts: Select chart types that best represent your data.

Tailor Your Dashboard: Add custom charts to your dashboard, making it as unique as your organization.

Hatica v3 lets you be creative with your data while deriving meaningful insights suited to your engineering team. 

A New Way To Approach Data-Driven Decisions with Hatica v3

We all know the frustration of sifting through endless information to find something actionable for the team. And let's be honest, the engineering world never sits still – new stuff pops up all the time!

I feel that is why the release of Hatica v3 solves a larger and more complex problem at hand - making data easily accessible and consumable. Hatica v3 is built to adapt. It's a flexible way to look at data with no more dead ends, just clear insights that keep you ahead of the curve. It essentially puts engineering productivity on autopilot and closes the loop on driving engineering productivity with an advanced engineering management platform. 

I’m confident Hatica v3 will change the way you leverage the engineering management platform to drive engineering productivity. 

This is just the start, though. We're in this for the long haul, working with engineering leaders like you to push the boundaries of what's possible. And thanks to the Hatican tribe who has worked and pushed all along to bring only the best for the best engineering teams across the globe.

If you're looking to give Hatica v3 a spin and see how it can boost your team's real-time efficiency, talk to our productivity experts today and they’ll give you a real-time insight into how leveraging Hatica v3 looks for your engineering team. And how easy it can be! 

Subscribe to Hatica's blog

Get bi-weekly insights straight to your inbox

Share this article:
Table of Contents
  • We Listened to You!
  • Data That Makes Sense for Your Team
  • Here's What You Get with Hatica v3:
  • Seeing the Big Picture
  • Supporting Developers and Teams Better
  • Keeping Software Delivery Smooth
  • Managing Data Overload
  • Customizations for Unique Needs
  • A New Way To Approach Data-Driven Decisions with Hatica v3

Ready to dive in? Start your free trial today

Overview dashboard from Hatica