The Blueprint to Measuring Engineering Organizations

Are you measuring engineering output or engineering outcomes? What if what you are measuring is just half the story? Read this blog to gain an in-depth perspective into measuring engineering organizations and their true impact in the “ship better products faster” age.
The Blueprint to Measuring
Engineering Organizations

As an engineering leader, you’re likely familiar with the challenge of showing the full impact of your engineering team’s work and effort. Engineers are the backbone of every product, constantly building, optimizing, and safeguarding the systems that drive the business outcomes. 

In 25+ years of my experience, I have seen that much of this work is invisible outside of engineering, making it difficult to highlight the full value your engineering team brings for all the stakeholders and customers.

Often, we’re asked for metrics to make this work visible and we jump onto measuring something to everything, yet not all metrics tell the same story and even worse they do not tie back well to tell a complete story at all. 

Some numbers help us track progress internally, while others are more relevant to the wider company. Whereas some might even be misleading. 

In this blog, I share my thoughts and opinion on finding that balance— on how to select practical, meaningful measurements that reflect real impact and how they can add meaningful interpretations for yourself, your peers, cross-functional stakeholders, and even the CEO and the Board. So, let's dive in. 

Understanding Why We Measure

I always tell my teams to ask this one basic question as Step 0 of Measuring the Impact of any engineering effort you put in. And that is to understand “why we measure what we measure” in the first place. Does that metric solve any purpose or help you or anyone in the team/org in any way? Great, else don’t measure.

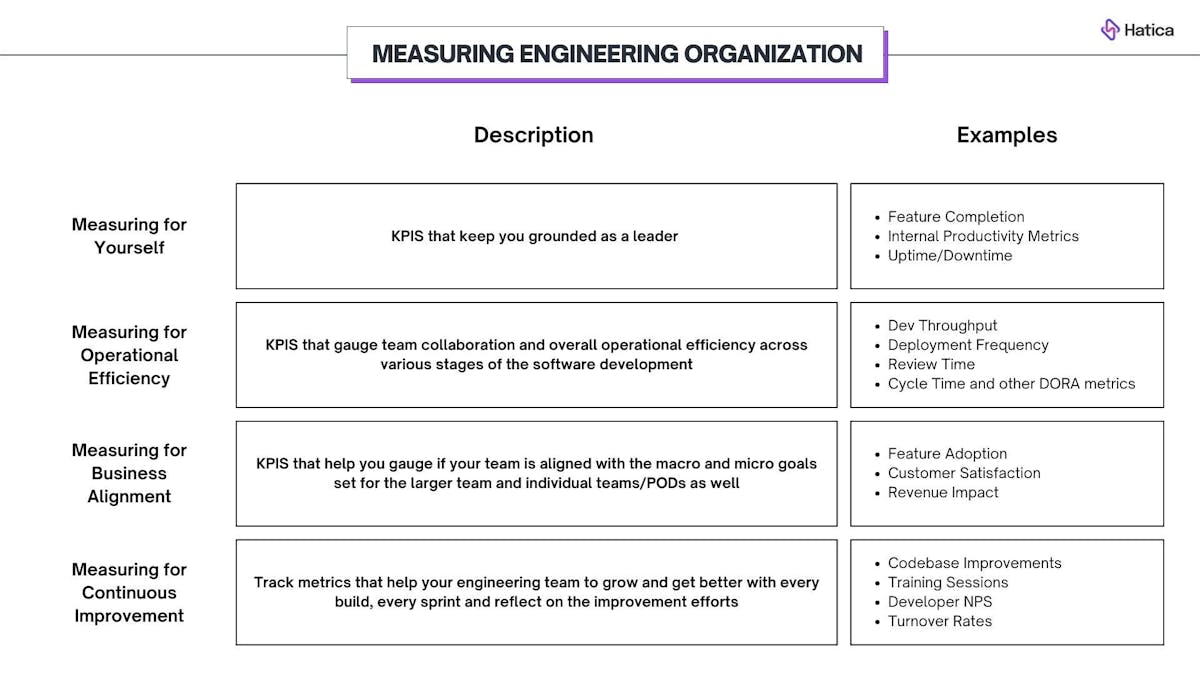
Measuring Engineering Organization - Template

When it comes to measuring engineering work, there’s more than one way to approach it—and not all paths lead to useful insights. The magic always lie in understanding why we’re measuring in the first place. A number on a dashboard might sound fancy but might not guarantee clarity; in fact, it can even be misleading.

So, why do we measure? And how do we ensure our metrics make a real difference?

Successful engineering teams know they need to measure both output (the speed and efficiency of work) and outcomes (the value and alignment of work with business goals). 

Focusing on one without the other often means falling short in both. Research shows that measuring both is essential to balanced performance, avoiding two common issues:

As you can see in the quadrants placed below:

  • Quadrant 1: : In this ideal scenario, the engineering team is working on projects that align with business goals and are delivering them efficiently. This quadrant represents optimal productivity, where teams deliver high-impact results within a competitive timeframe. Teams here are focused, aligned, and fast, which provides a significant strategic advantage.
  • Quadrant 2: Building the wrong things quickly. Here, the engineering team may be efficient, but they’re working on projects that don’t align with real business needs, wasting time and resources.
  • Quadrant 3: Building the right things too slowly. Although the work aligns with business goals, the slow pace risks losing competitive advantage, meaning the value may come too late.
  • Quadrant 4: Building the wrong things slowly. This is the least favorable quadrant, where the engineering team is both slow and misaligned with business goals. Not only are they focusing on projects that don’t provide value to the company, but they’re also doing so inefficiently, which compounds the waste of resources.
Measuring Engineering Organisations - Quadrants

As an engineering organization grows, intuition, relationships, and gut feeling alone aren’t enough. Moving from “winging it” to informed, data-driven decisions ensures that engineering’s work consistently supports the bigger picture and the company’s growth trajectory.

With that in mind, let’s explore how you can approach the right metrics can make a real difference.

Start with Your Own Dashboard: Measuring Metrics for Yourself

Before building metrics for others, let’s begin with the indicators that keep you grounded as a leader. I cannot emphasize this enough. Every time I have stumbled upon figuring out what to measure, I have gone back to the storyboard asking will this metric be useful for me as as an individual, team member and team lead? Identify those metrics and engineering KPIs that matter to you first.

These KPIs are your internal compass, helping you through the complexities of development and keeping your engineering team’s focus on what truly matters.

Measure What Moves the Needle

  • Are we on track? Are your engineering team’s efforts translating into real business value? Tracking shipped features and their impact on business outcomes provides a clear, honest view of how much you’re moving the needle—or whether certain projects are falling short of expectations. This can be measured over a sprint cycle, a month or a quarter - whatever suits your engineering team and organization.
  • Is everything running smoothly? Is your engineering team as productive as it is reliable? Keeping an eye on incident rates and productivity metrics isn’t just troubleshooting; sometimes, these patterns reveal deeper inefficiencies or underlying issues that need more than a quick fix. And sometimes they turn out to be a great revelation into impending events, which you would have missed noticing otherwise.
  • Can we do better? Could your engineering team’s processes be leaner or more effective? Measuring productivity improvements can expose areas ripe for optimization—but it’s also a reminder that sometimes, “doing better” is about knowing when not to push for more. 

With a solid grasp of these internal metrics which make perfect business sense for you, you’ll be equipped to share an authentic story with stakeholders—one that’s rooted in real impact and a balanced understanding of your team’s strengths and challenges.

Now let’s get into the heart of metrics and ways to build from there.

Should You Measure Outputs or Outcomes? 

We touched on this earlier, but this section gets into the intricacies. 

Output metrics capture the pace and productivity of engineering work, and outcome metrics assess its impact and alignment with business goals. 

Combining both provides a holistic view of engineering effectiveness. 

Measuring Output

Measuring output—especially in a meaningful way—can be challenging. 

Traditional metrics often miss the mark or even create incentives that don’t reflect true productivity. Here’s a breakdown of some commonly used measures that don’t always capture meaningful output:

  • Lines of Code
    Tracking lines of code can encourage verbose or redundant work rather than efficient solutions. Higher code volume doesn’t necessarily equate to greater value. Focusing on quality-oriented metrics or efficiency within the codebase can yield better insights.
  • Number of Commits or Pull Requests (PRs)
    Counting commits or PRs may incentivize breaking work into smaller parts to artificially boost productivity metrics. A more valuable approach is to consider the substance and impact of PRs, focusing on quality improvements and meaningful contributions.
  • Story Points
    Story points aim to quantify effort, but their subjectivity makes consistency difficult across teams. They can provide insight into workload and progress within a single team but aren’t reliable for measuring productivity or comparing teams.
  • DORA Metrics
    DORA metrics (such as deployment frequency and lead time for changes) offer insights into the team’s DevOps performance and responsiveness. While helpful, these metrics need context about what is being deployed to truly capture productivity.

While these metrics are good to have, it would be foolish to jump onto conclusion basis these data points alone. That is why it is important to marry context into these output metrics and tie them to the business outcomes to see if they are really driving anything within and outside the engineering team.

Measuring Outcomes

Measuring outcomes means capturing the real-world impact of the engineering work you do—the business results from building the right things. Outcomes circle around the overall effectiveness, and answering a very important question: Did this work make a difference?

  • Feature Completion
    Tracking completed features gives a sense of progress, but without examining how features perform post-launch, it’s difficult to gauge their actual value. Measuring outcomes means looking at feature usage and satisfaction metrics to see if they meet user needs.
  • User Engagement
    Engagement metrics indicate how frequently users interact with a feature, providing insights into behavior and interest. When combined with satisfaction metrics, user engagement helps determine if a feature adds value or meets its intended purpose.
  • Revenue Impact
    Tying specific engineering work to revenue impact provides a direct line to business goals. While complex, this connection highlights the features or improvements that most directly drive financial outcomes, making it actionable for prioritizing future work.
  • Customer Satisfaction (CSAT) and Net Promoter Score (NPS)
    These scores gauge user satisfaction and loyalty, offering insights into how engineering efforts impact the user experience. These metrics work well alongside other outcome metrics tied directly to engineering work, adding depth to the understanding of user sentiment.
  • Adoption Rate of New Features
    Tracking how widely new features are adopted shows how well they meet user needs and align with market demands. Adoption rates can reveal the relevance and usability of features, highlighting areas where engineering work has the most immediate impact.

Measuring outcomes effectively goes beyond task completion, capturing how engineering efforts align with broader business goals. This often involves pairing quantitative metrics with qualitative insights, like user feedback, to fully understand the impact on users and the business.

When combined, output and outcome metrics provide a balanced view that helps reveal insights that might otherwise be missed or misinterpreted.

Measuring Engineering Effort for Stakeholders

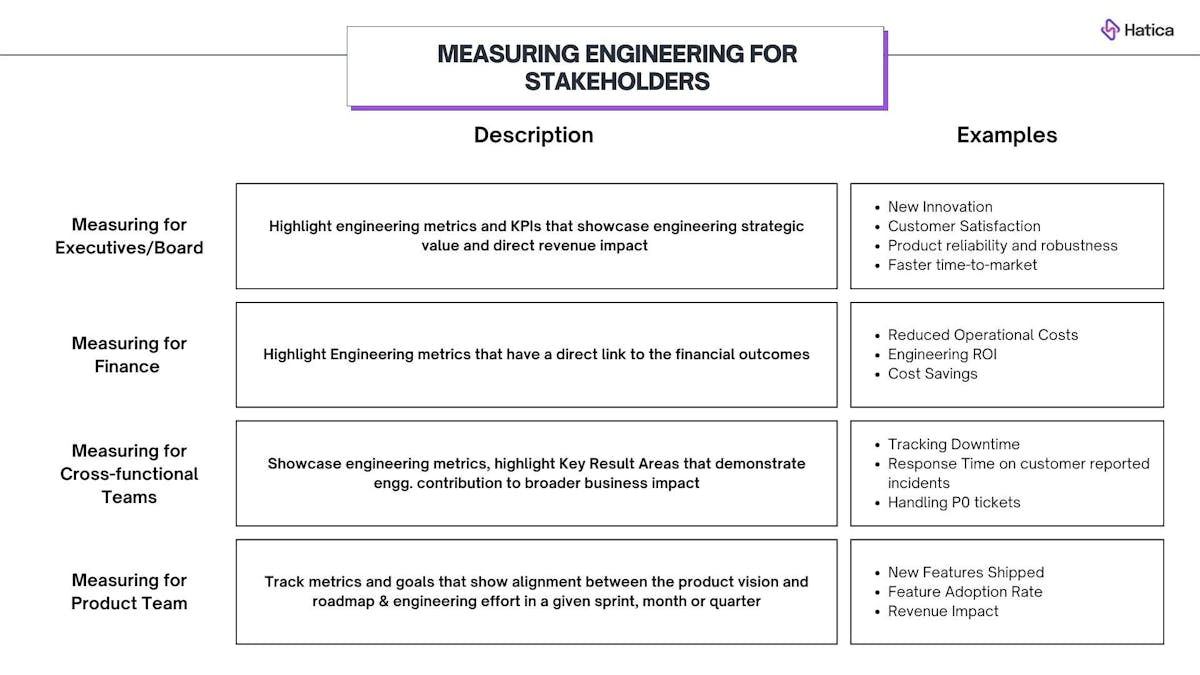
Measuring Engineering Organization

Engineering’s work touches a lot of different groups across the company, each with its own priorities. From executives to cross-functional teams, everyone needs specific insights to really see how engineering supports the bigger picture. For a helpful breakdown of what each group typically cares about, check out this blog:Guide to Reporting Up for Engineering Leaders.

But let me tell you this approach doesn’t come easy and is not inherently tied into the way Engineering teams operate. I have seen that first-hand. It needs some conscious effort and deliberation to incorporate this approach of 

  1. Identifying engineering metrics that matter to you
    followed by
  2. How engineering effort translates into business outcomes
    and
  3. What does that outcome mean for other stakeholders and how can that be communicated?

Once you know what matters to each group, you can focus on the main types of metrics to communicate engineering’s impact: We cover this next:

Impact Metrics: Showing Engineering’s Value to the Business

Impact metrics go beyond day-to-day tasks—they connect engineering’s work to the company’s larger objectives. These metrics translate technical efforts into outcomes that resonate with the broader organization, showing how engineering supports goals like customer satisfaction, product reliability, and cost efficiency.

Examples of effective impact metrics include:

  • High uptime and smooth system performance directly influence user experience, underscoring engineering’s role in maintaining reliability.
  • Linking engineering outcomes to customer feedback, to illustrate how technical work impacts the user experience—insights that are especially valuable to teams like Product and Marketing.
  • Demonstrating how engineering optimizes resources (e.g., cloud cost savings or improved system efficiency) highlights the engineering team’s role in controlling costs and maximizing value for the company.

Impact metrics make engineering’s work clear and relevant to stakeholders. By connecting technical achievements to user satisfaction or cost savings, they show engineering’s importance in ways that matter to the broader organization. 

Now this is something stakeholders are in a better position to relate with in comparison to plain metrics that might only lead to more questions and confusion.

Growth Metrics: Supporting Team Development Over Time

Growth metrics center on the engineering team’s ongoing journey—how we’re building skills, refining processes, and steadily improving. These metrics let us see progress over time, encouraging a culture of continuous improvement without constant pressure to optimize for speed.

Here are some key growth metrics:

  • Tracking sessions like training, peer reviews, or workshops shows our investment in the team’s development and closing knowledge gaps.
  • Measuring improvements to outdated or inefficient code reflects our commitment to healthier, more sustainable systems.
  • High satisfaction and low turnover signal a motivated, engaged team and a positive culture.

Growth metrics are for internal use and show the progress that may not be visible in everyday metrics.

Operational Metrics: Keeping the Engine Running Smoothly

Impact and growth metrics give us the big picture, but operational metrics handle the nuts and bolts of daily work. They help engineering leaders gauge how efficiently things are running—from development cycles to release stability. 

Think of operational metrics as the dials on a dashboard, showing what’s moving smoothly and where tweaks might be needed to keep everything on track.

Mean Time to Recovery (MTTR), Cycle Time, Deployment Frequency, and Change Failure Rate are essential operational metrics that keep your engineering team sharp and responsive. We’ve broken down each of these metrics in-depth across our blogs, showing how they drive efficiency within the broader Software Development Life Cycle (SDLC).

With these metrics balanced alongside impact and growth metrics, you get a well-rounded picture—keeping your team efficient, stable, and always ready to deliver.

Now that you've highlighted the direct impact of your engineering team, it’s crucial to address how these efforts align with the organization’s financial objectives. Let’s get into that in the next section.

Measuring for Finance: Aligning Engineering with ROI

Building for finance means proving that every dollar spent on engineering contributes meaningfully to the company’s bottom line. The key challenge is connecting engineering metrics like we discussed in depth earlier to financial outcomes—like reduced operational costs, minimized downtime, and faster time-to-market—to create a clear picture of engineering’s ROI.

When you bridge this gap, finance sees engineering as an investment with compounding returns. 

While engineering’s value isn’t always immediate or easy to measure, it plays an integral role in making the organization more adaptable and poised for growth. 

This understanding helps finance feel more confident in allocating resources to engineering, knowing it directly supports the business’s stability and scalability.

Once finance views engineering through this lens, it becomes not just a contributor to the bottom line but a foundational driver of long-term financial resilience.

The Final Thoughts on Measuring Engineering Organizations in 2025

Engineering metrics show the real value that engineering brings to the organization. We all know that engineering’s worth isn’t found in just a single metric—but it’s about starting somewhere and then getting into the bigger story these numbers reveal. 

Quiet improvements in things like cycle time or MTTR may not grab attention right away, but they’re setting up your engineering team for fewer crises, lower costs, and steady growth down the line.

Think of it this way: each small tweak, each process improvement, and every reduction in response time is a step toward building resilience. These changes don’t just keep things running smoothly; they let the company keep moving forward without constant firefighting.

This is the true story behind engineering metrics. 

While some metrics matter to you alone, and other metrics will matter to the larger team - there always have to be finer ways to identify metrics/outcomes/parameters that can translate engineering effort to business outcomes for everyone to see the value your engineering team brings

So, the next time you look at those numbers, remember—they’re more than just data points. They’re the building blocks of a strong, sustainable engineering organization.

If you’d like to learn more about how you can leverage metrics to boost your engineering team, connect with our productivity experts today. 

FAQs

  1. What are the methods of measuring engineering impact?
    You can track engineering impact through feature adoption, customer satisfaction (NPS), and revenue impact from new features. Operational metrics like uptime and incident resolution also underscore engineering’s role in product reliability.
  2. How to measure engineering effectiveness?
    Measure engineering effectiveness with a mix of output and outcome metrics. Output metrics like cycle time and deployment frequency reflect efficiency, while outcome metrics such as feature adoption and customer satisfaction show the impact on business goals.

Subscribe to Hatica's blog

Get bi-weekly insights straight to your inbox

Share this article:
Table of Contents
  • Understanding Why We Measure
  • Start with Your Own Dashboard: Measuring Metrics for Yourself
  • Measure What Moves the Needle
  • Should You Measure Outputs or Outcomes? 
  • Measuring Output
  • Measuring Outcomes
  • Measuring Engineering Effort for Stakeholders
  • Impact Metrics: Showing Engineering’s Value to the Business
  • Growth Metrics: Supporting Team Development Over Time
  • Operational Metrics: Keeping the Engine Running Smoothly
  • Measuring for Finance: Aligning Engineering with ROI
  • The Final Thoughts on Measuring Engineering Organizations in 2025
  • FAQs

Ready to dive in? Start your free trial today

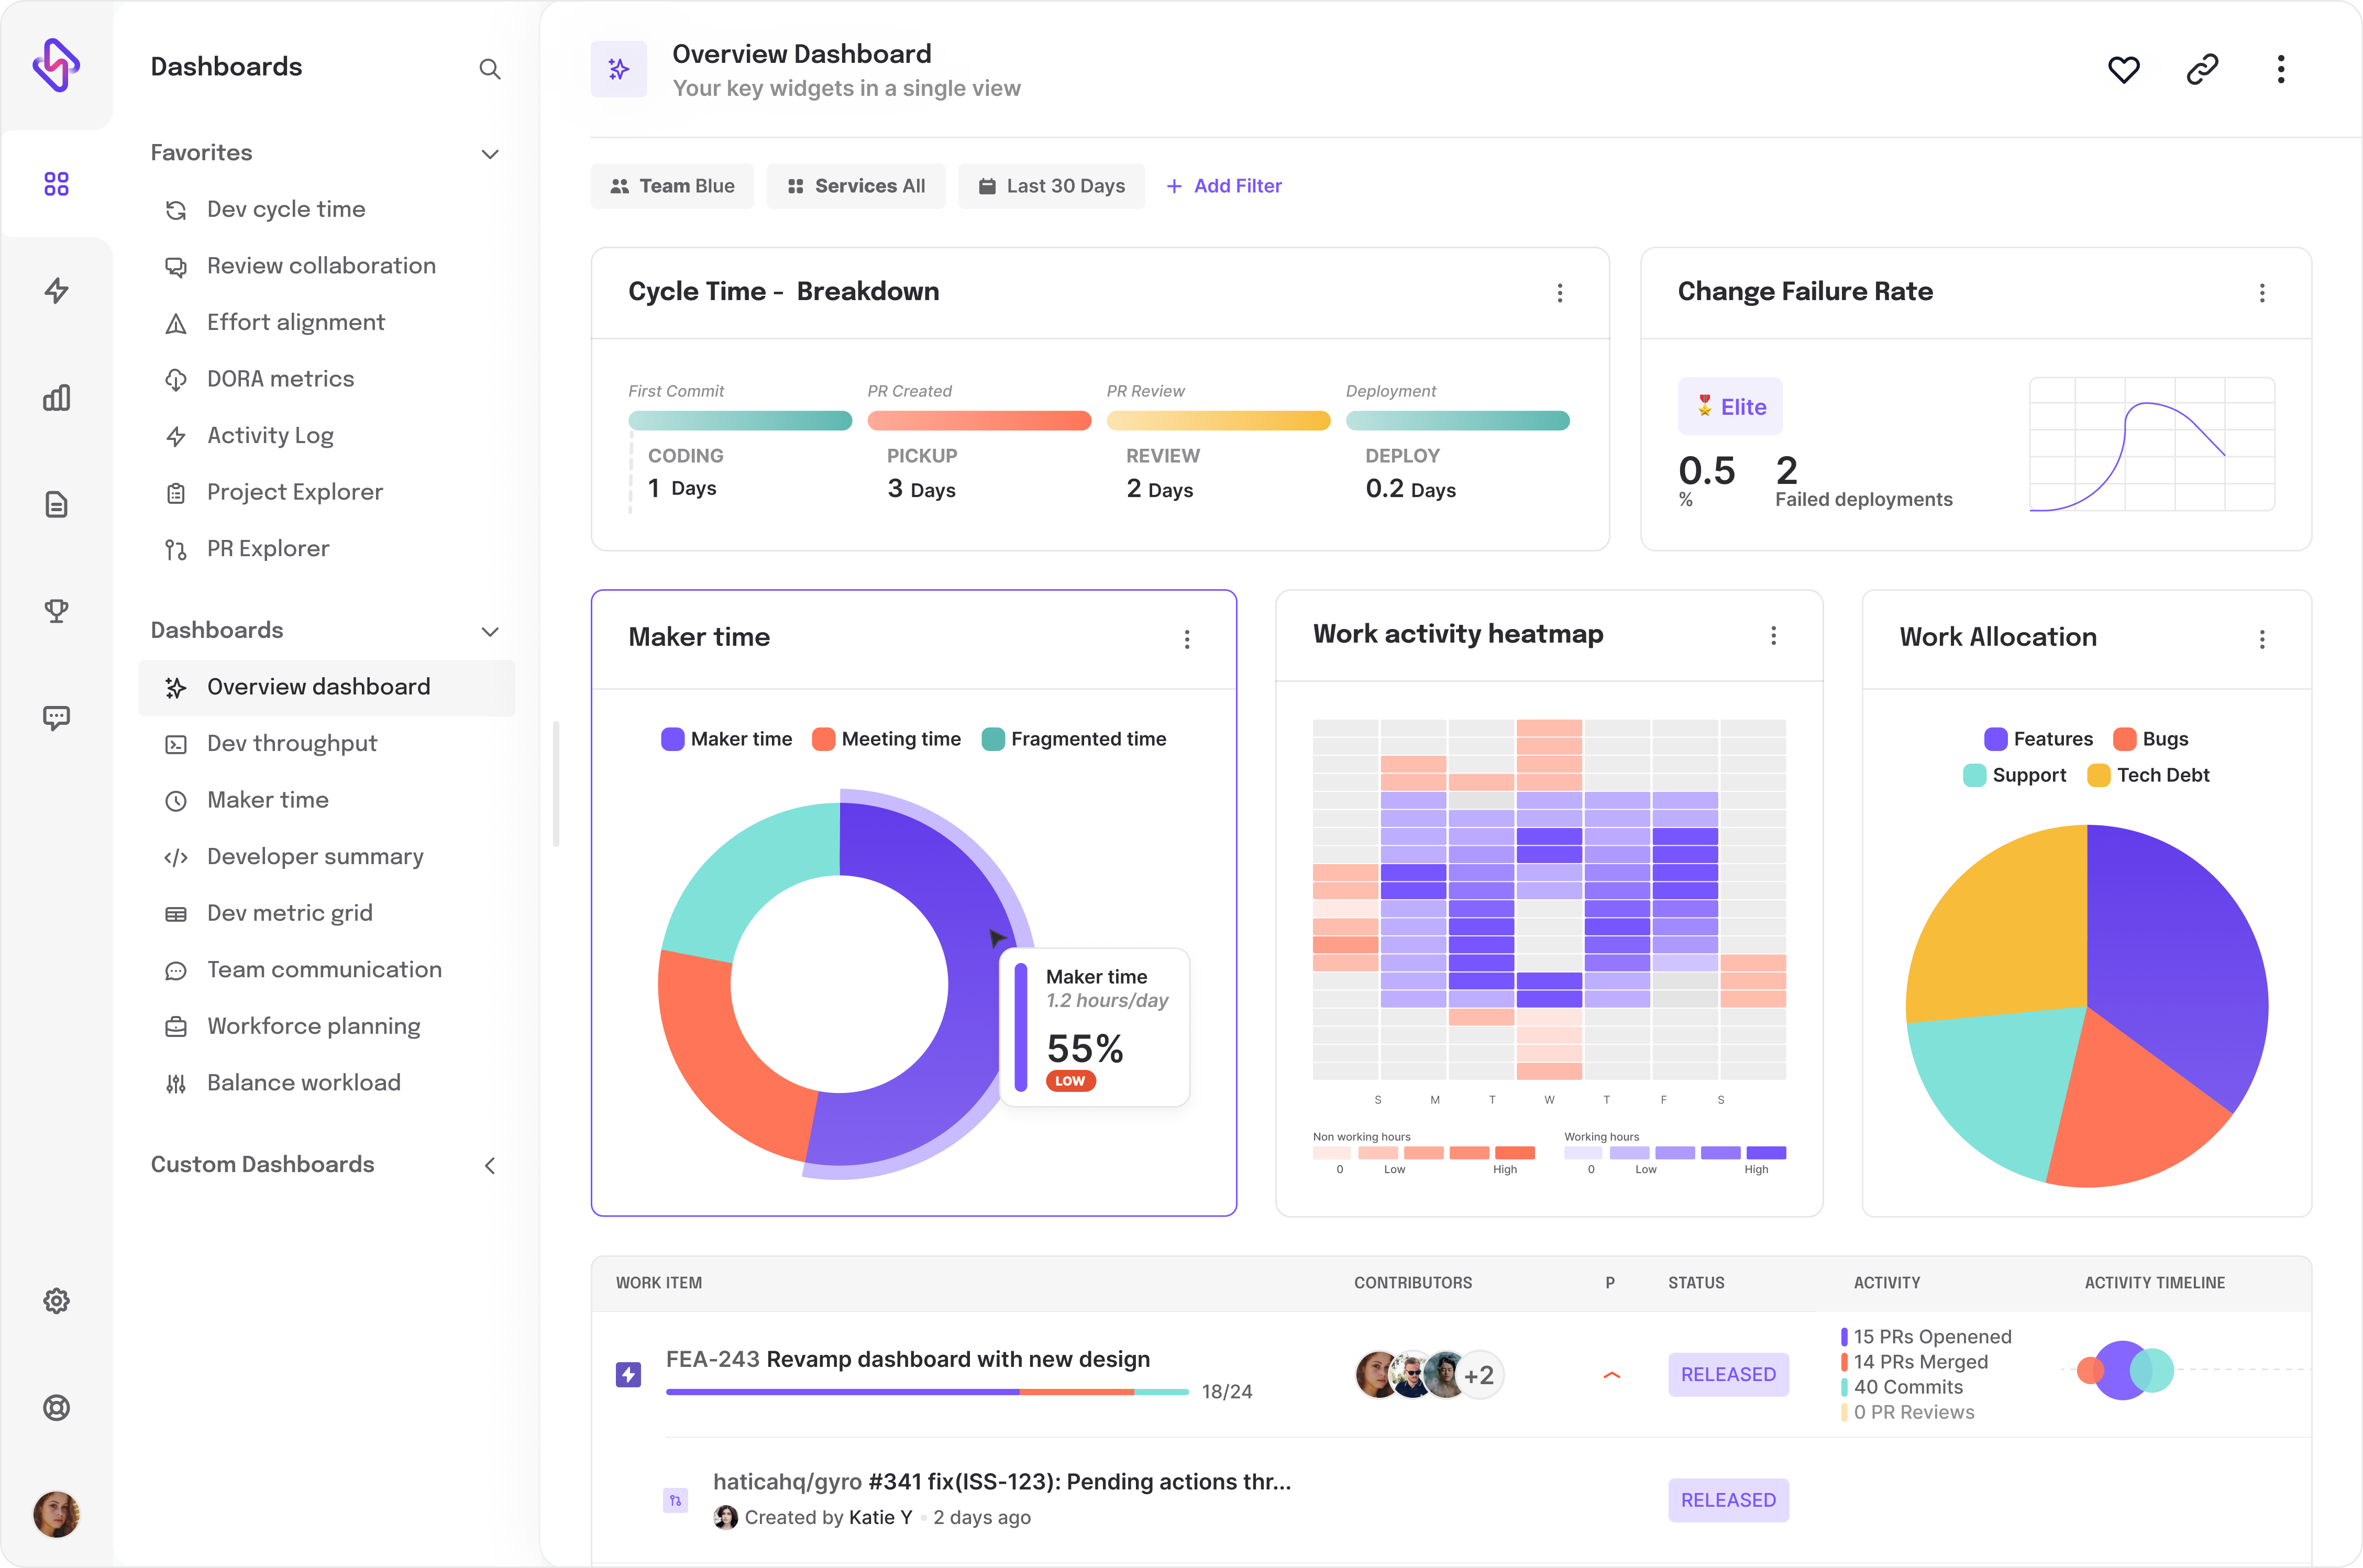
Overview dashboard from Hatica