Activity Teams
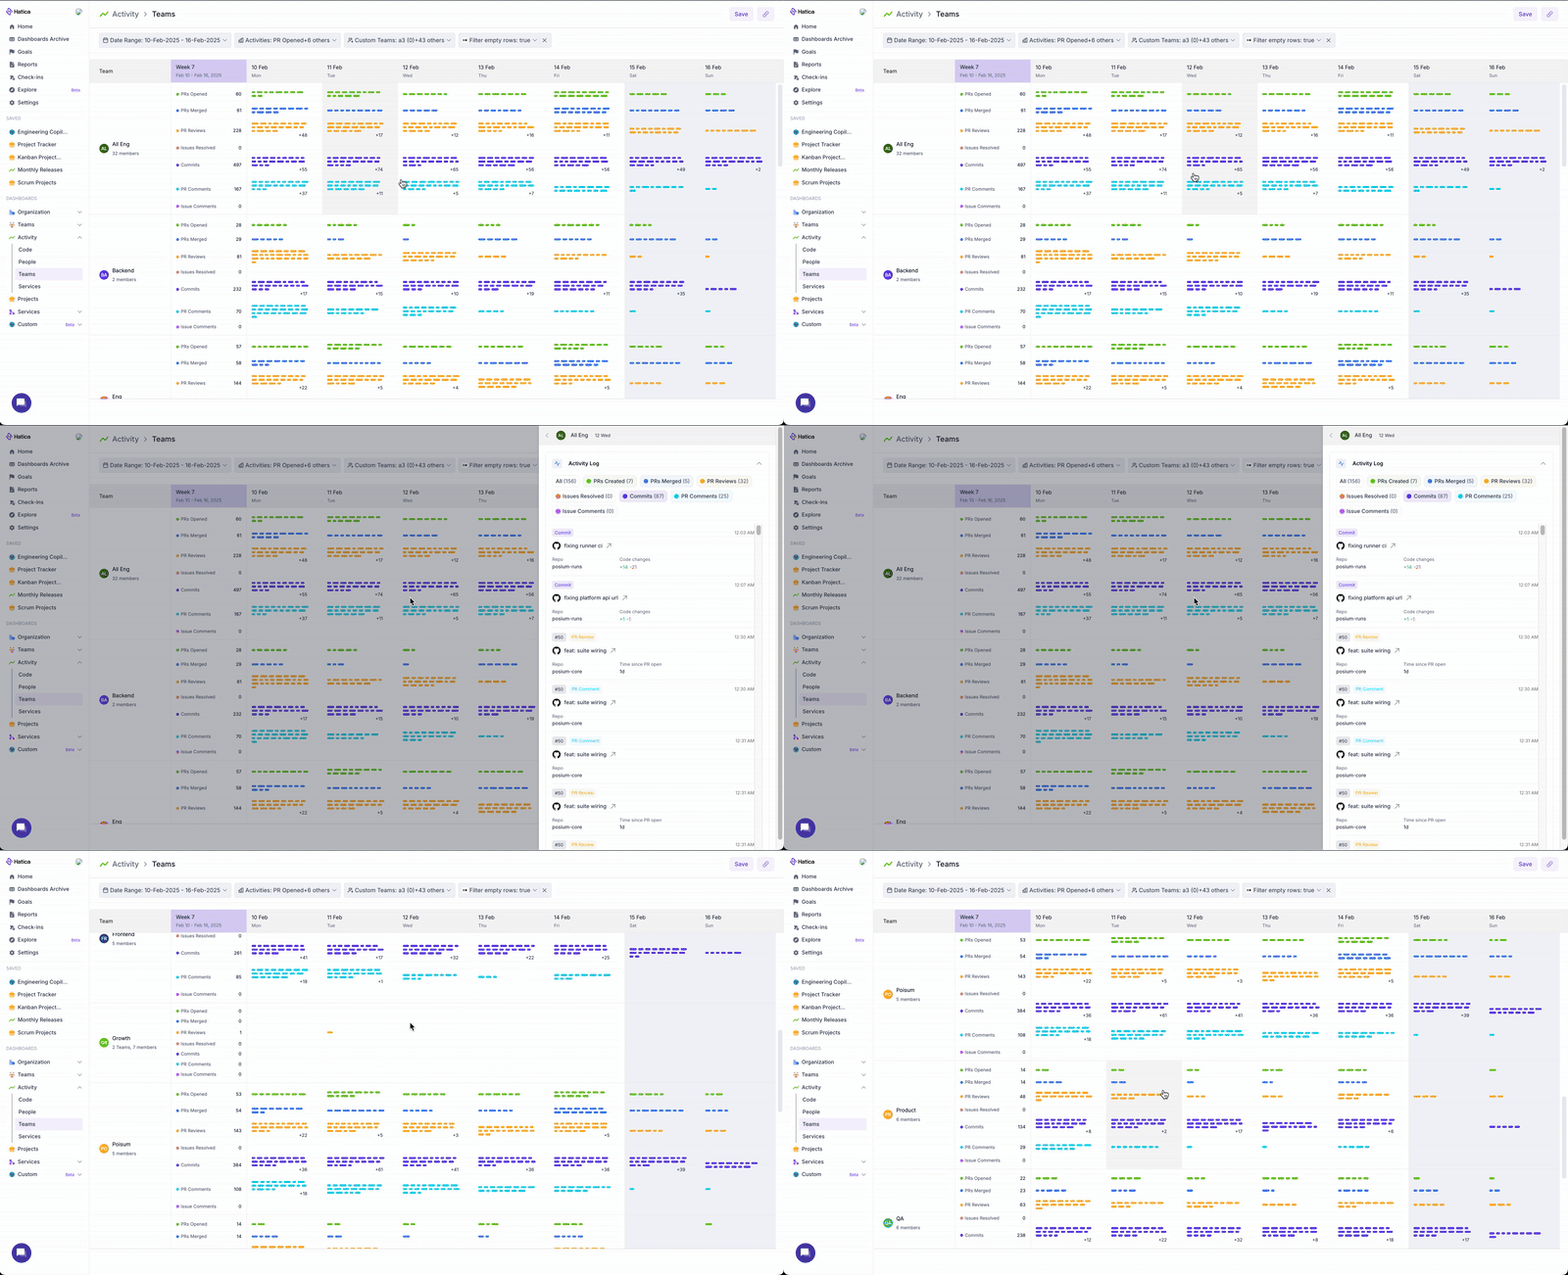
The Teams Dashboard provides team-level insights into engineering activities, helping teams track their collective contributions, review cycles, and collaboration patterns.

Data Sources
All activity data is sourced from Git/VCS and Project Management tools integrated with Hatica.
Filters
- Date Range Picker: Select a specific time period to view relevant metrics.
- Teams: Select a specific team or multiple teams.
- Activities: Select specific activity types such as:
- PRs Opened
- PRs Merged
- PR Reviews
- PR Comments
- Issues Resolved
- Commits
- Custom Teams: Filter based on pre-defined custom teams.
- Filter Empty Rows: Hide teams with no recorded activity during the selected period.
How to infer this data?
Each activity type is color-coded to help users quickly identify activity distribution.
Color and Band Size:- Color coding differentiates activity types, making it easy to spot trends.
- Band density represents the volume of activity—packed cells indicate high engagement, while empty cells indicate no recorded activity.
- Pill size varies based on task significance—larger pills represent bigger tasks or higher effort, while smaller pills indicate smaller contributions.
Summary Column: The second column summarizes the total number of activities per team for the selected period. Engineering teams typically show higher Git activity, while cross-functional teams may have more review or issue-related activities.Day-Level Summaries: Clicking on a specific day within a team's row opens the context window showing all activities completed by the team on that day, providing deeper insights into their workload.
The Commit data only accounts for Remote commits; any commits done on Local Git branches are not included here. So if your team has a habit of doing all development on a local branch and pushing it to a remote branch after a period of time, you may not see any Commit activity.
If your engineering teams follow a process where work is batched and pushed to remote only after completion, the activity distribution may not reflect daily progress accurately.
How to Use This Dashboard
- Compare team contributions across PRs, reviews, and commits.
- Identify bottlenecks where teams have too many open PRs or delayed reviews.
- Monitor sprint execution by analyzing activity patterns over time.
- Zoom into specific teams by clicking on a team’s row for detailed insights.
- Track review distribution—are review efforts evenly spread across teams?
- Optimize sprint planning by identifying patterns of team performance over time.