Organization Copilot Usage
The Copilot Dashboard provides comprehensive insights into GitHub Copilot (opens in a new tab) usage across your organization. It enables engineering leaders to understand adoption patterns, evaluate license utilization, track engagement metrics, and analyze usage trends across different dimensions like programming languages, IDEs, and teams.
GitHub Copilot is an AI pair programmer that helps developers write better code faster. The Copilot Dashboard in Hatica gives you visibility into how your organization is utilizing this tool, helping you make data-driven decisions about your Copilot investment.
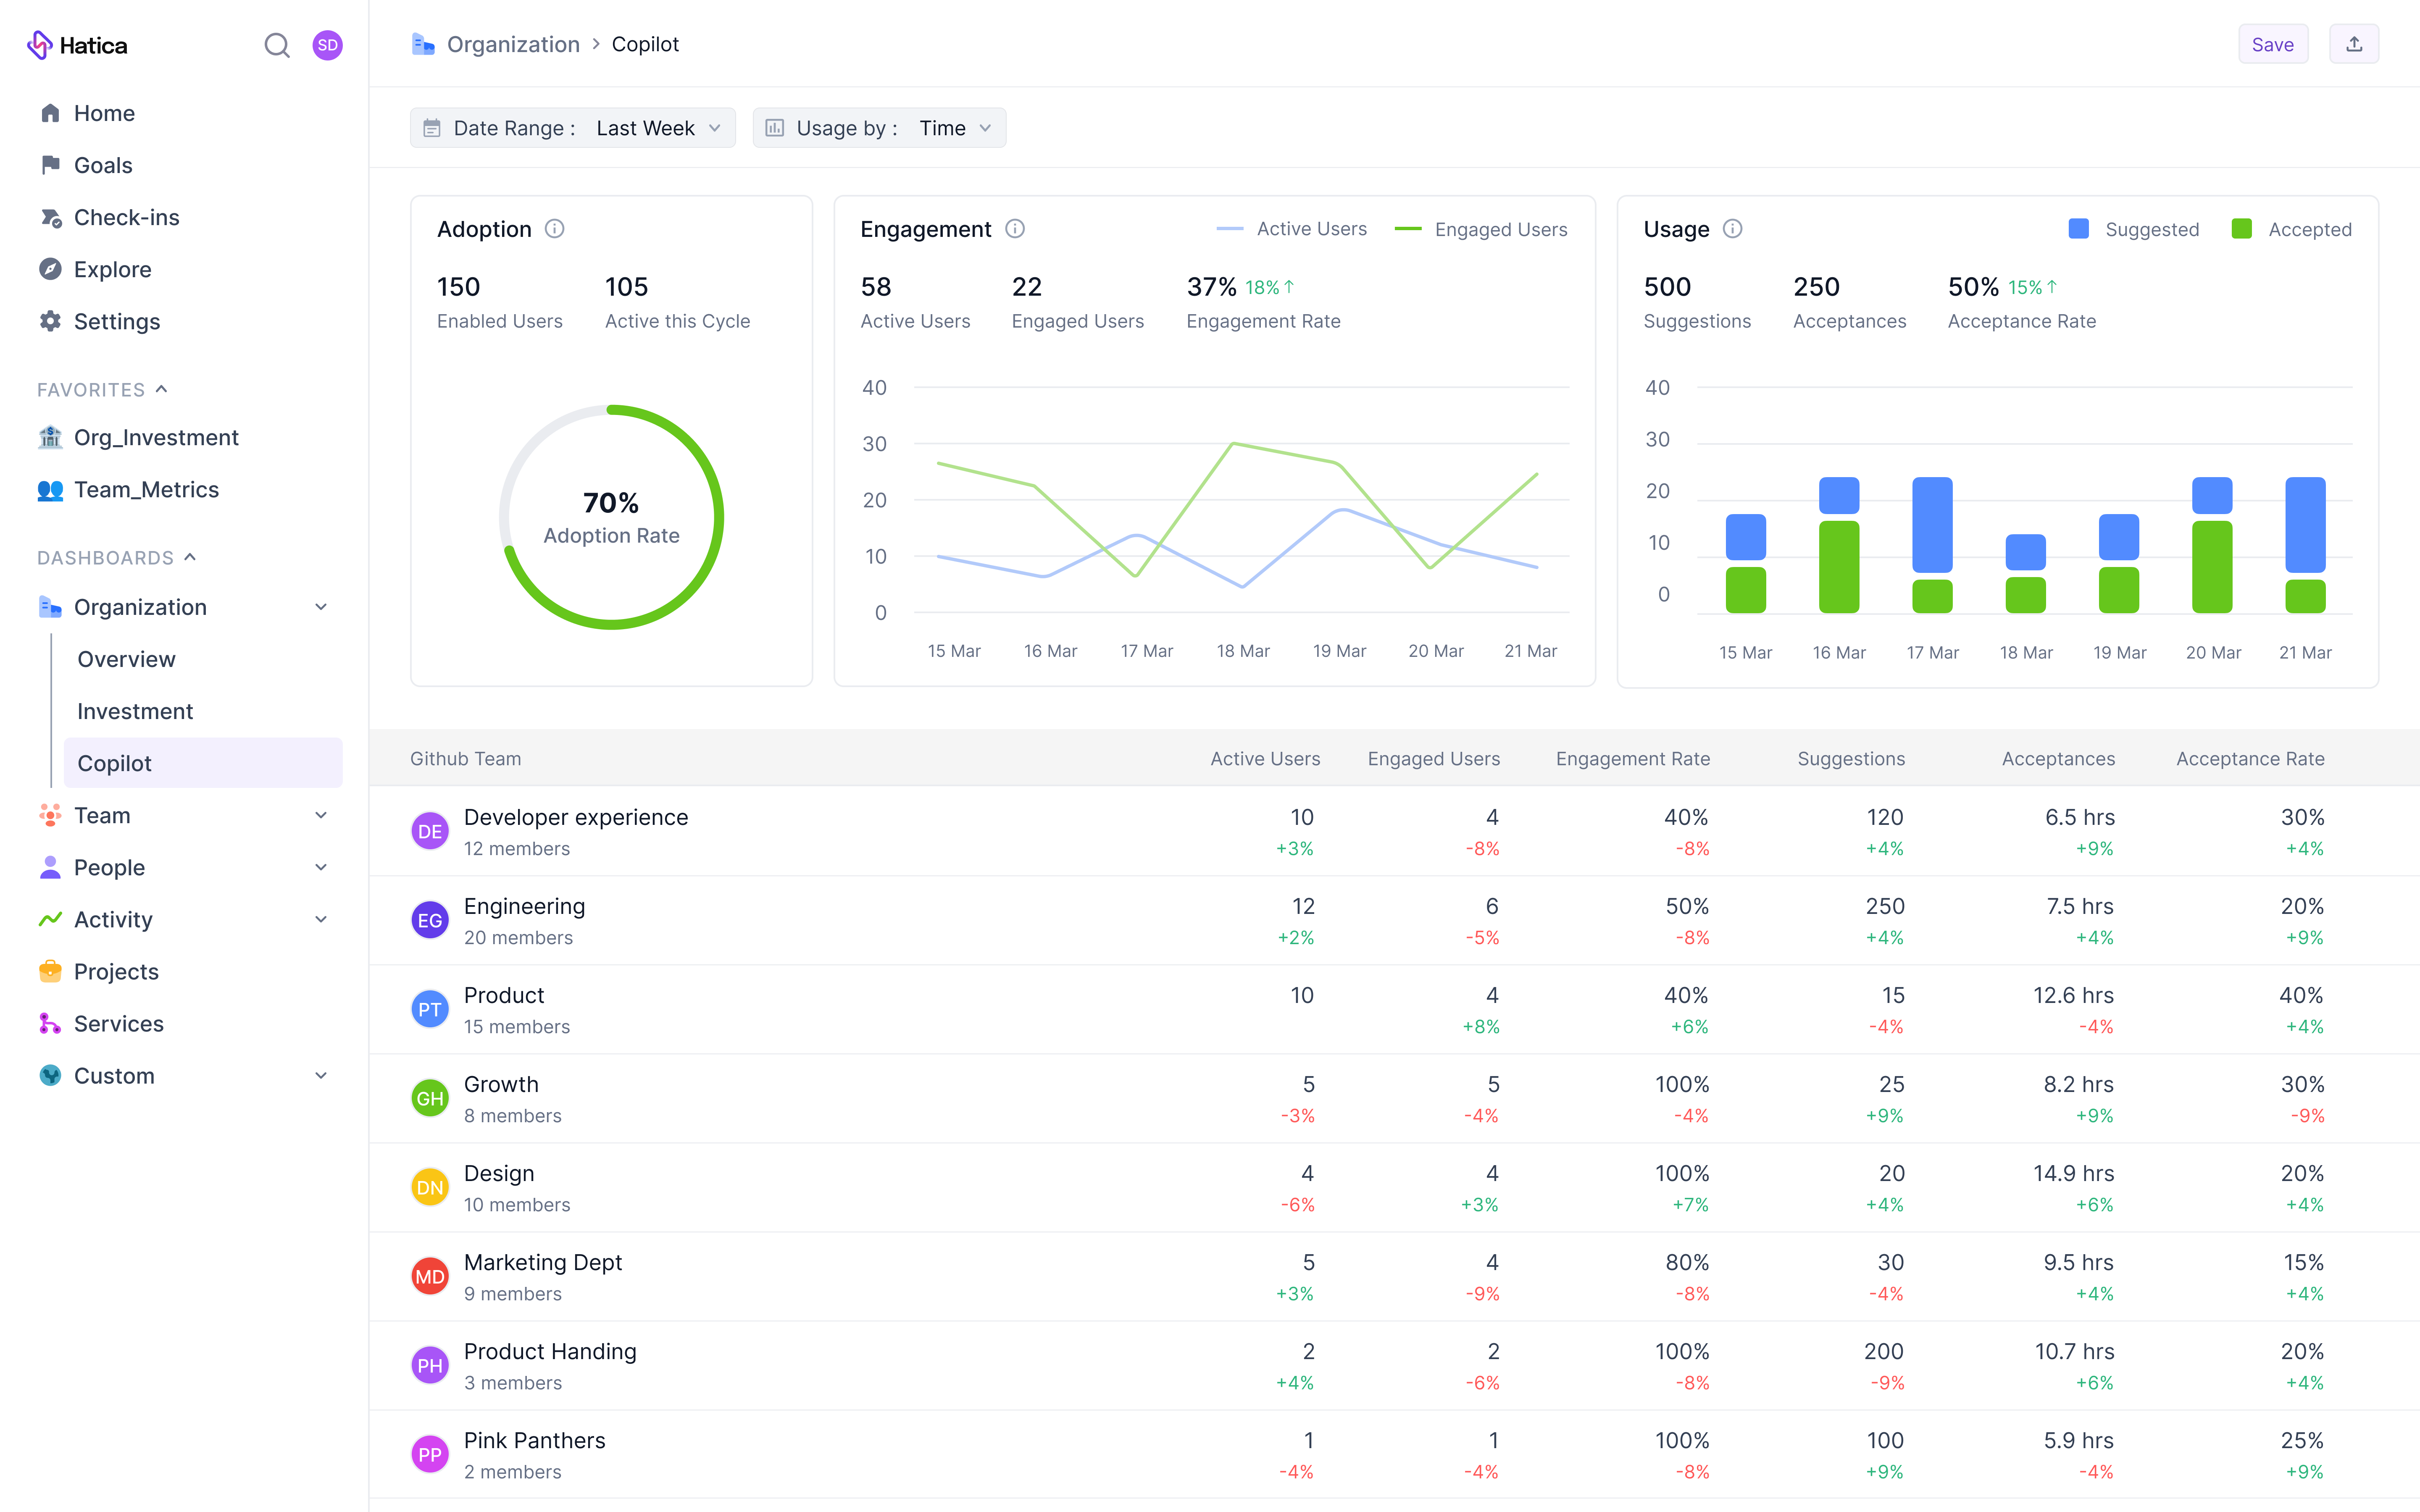
When you click on "Copilot" in the Organization section of the sidebar, you land on the main Copilot Dashboard page. This dashboard offers a quick view of key adoption and engagement metrics, along with usage breakdowns that can be analyzed across different dimensions.
Data Sources
The dashboard is powered by GitHub Copilot APIs that provide usage metrics for your organization:
- Github Copilot Organization-level usage metrics (opens in a new tab)
- Github Copilot Team-level usage metrics (opens in a new tab)
- Github Copilot Seat details and license utilization (opens in a new tab)
Hatica requires additional GitHub permissions to access this data. For more information about these required permissions, see GitHub's documentation (opens in a new tab).
Give Hatica Access to GitHub Copilot Metrics
Even if GitHub is already connected to Hatica, you'll need to grant specific permission for Copilot metrics. To update permissions:
- Go to your Organization's Settings
- In the left sidebar, navigate to Integrations → Applications
- Locate Hatica under "Installed GitHub Apps"
- You'll see a request to review updated permissions. Click Review Request
- Accept the updated permission to grant read-only access to Copilot Metrics
GitHub's API only provides data for the past 28 days. Once permission is granted, Hatica will retain and surface Copilot usage data going forward. To ensure complete coverage, we recommend enabling permissions as soon as possible.
Data Limitations
- Historical Data Window: GitHub's API only provides data for the past 28 days. However, once permission is granted, Hatica stores historical data and continues to surface metrics beyond that window.
- Data Availability: Copilot usage data is available starting from up to 28 days before the date you granted Hatica access.
- Minimum User Threshold: Data is shown only when 5 or more users had active Copilot licenses on a given day.
- Telemetry Requirement: Copilot usage is counted only when telemetry is enabled in the IDE.
- Environment Restrictions: Metrics exclude GitHub Enterprise Cloud instances with data residency on GHE.com.
- Team Requirements: Team-level breakdowns require GitHub Teams. Teams created in Hatica or Azure will not show Copilot data unless synced manually via GitHub.
These limitations are due to GitHub API. Read more in their documentation here (opens in a new tab).
Metrics
Adoption
- Enabled Users: Total number of seats being billed for the organization as of the current billing cycle. This represents your organization's total Copilot license allocation.
- Active This Cycle: Number of seats that have used Copilot at least once during the current billing cycle. This shows how many allocated licenses have been utilized.
- Adoption Rate: Percentage of provisioned seats that have been used at least once in the current billing cycle (Active This Cycle / Copilot Seats × 100). This metric helps evaluate the efficiency of your Copilot investment.
Engagement
- Active Users: Average number of users per day who received Copilot suggestions (passive use). This includes any user who had a Copilot feature activated, such as receiving code suggestions, regardless of whether they interacted with those suggestions.
- Engaged Users: Average number of users per day who actively engaged with Copilot by accepting suggestions, using chat features, or generating PR summaries. This measures deliberate interaction with Copilot features.
- Engagement Rate: Percentage of active users who deliberately engaged with Copilot features (Avg Engaged / Avg Active × 100). This metric shows the portion of users who find value in Copilot's suggestions.
Usage
- Suggestions: Total count of code completions generated and offered by GitHub Copilot. This represents all the AI-generated code snippets presented to developers.
- Acceptances: Total count of code suggestions that were accepted and incorporated by developers. This includes both full and partial acceptances of the suggested code.
- Acceptance Rate: Percentage of suggestions that were accepted by developers (Total Acceptances / Total Suggestions × 100). This metric indicates how relevant and useful Copilot's suggestions are to your development teams.
Filters
- Date Range: Select a custom date range to view metrics for a specific time period. This filter leverages Hatica's internal data store and is not limited by GitHub's 28-day window.
- Usage By: Pivot your data in the usage chart across four dimensions:
- Time: X-axis becomes a daily/weekly/monthly timeline
- IDE: Breakdown by editors (VS Code, IntelliJ, etc.)
- Language: Programming language-level view (JavaScript, Python, etc.)
- Model: Breakdown by Copilot model used (default vs. custom)
Adoption
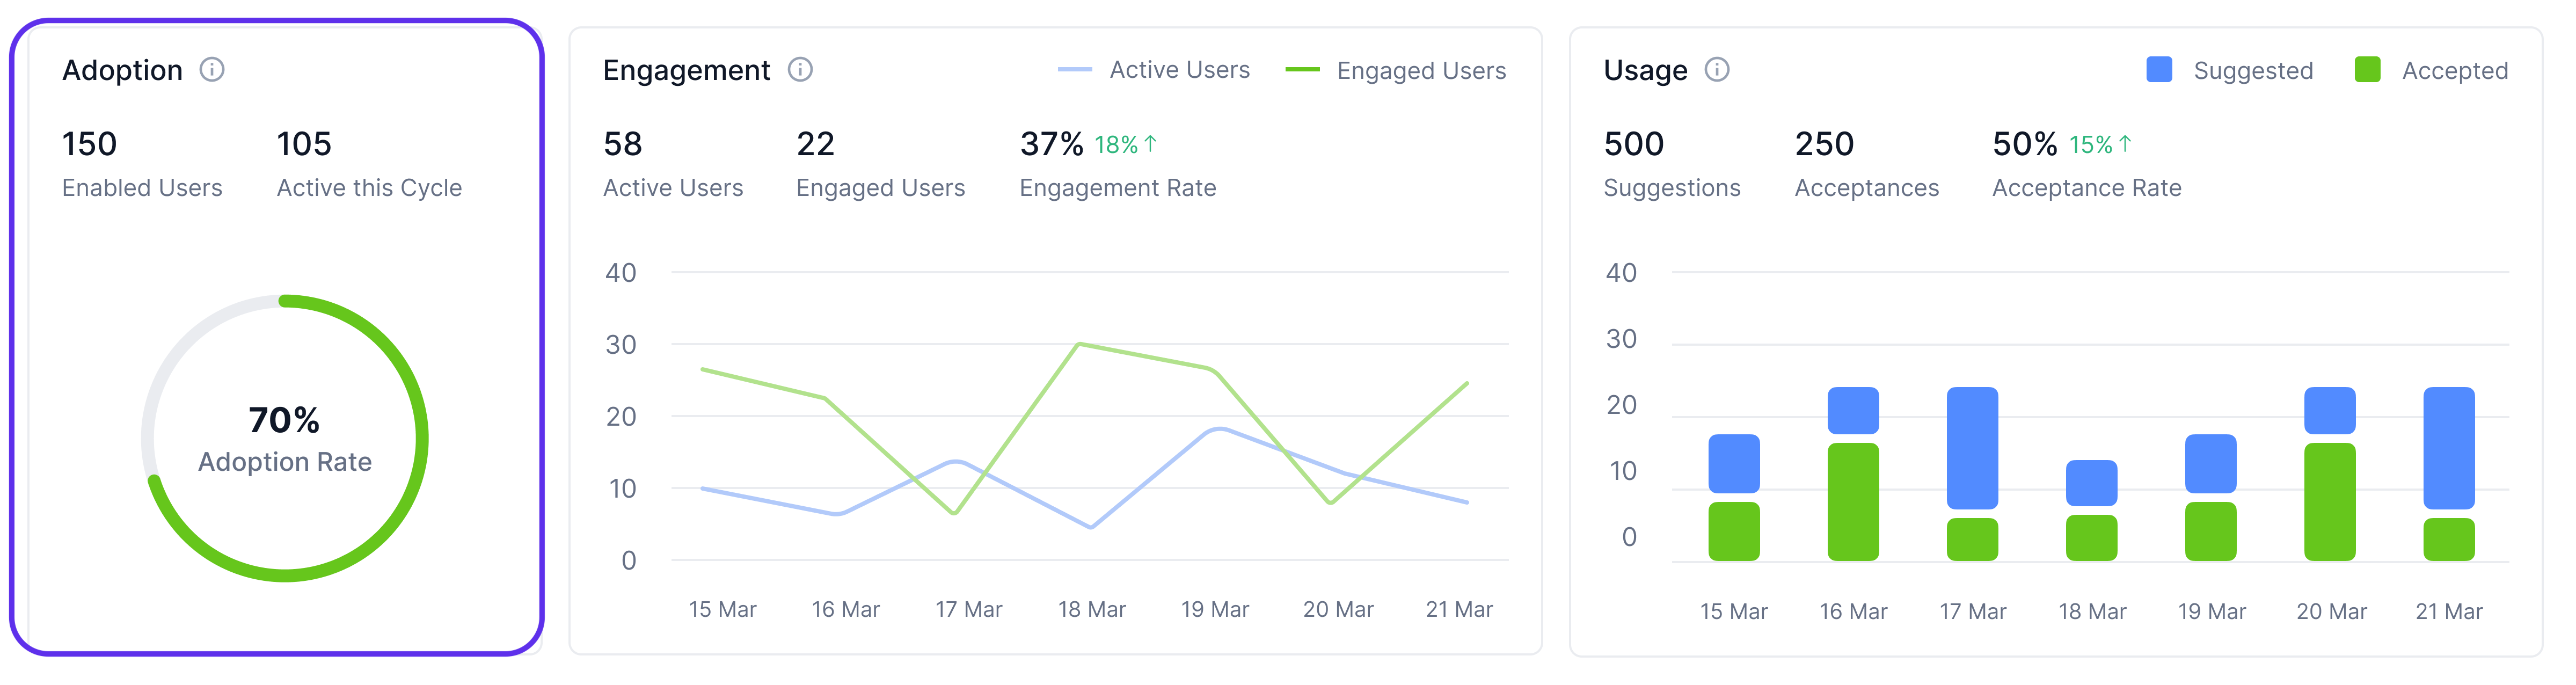
This widget focuses on license utilization at the billing cycle level, helping you understand the return on your Copilot investment.
Unlike other widgets, this section shows data for the current GitHub billing cycle only and does not change based on the date filter. It displays the total Copilot Seats your organization is provisioned for, how many have been Active This Cycle, and calculates the overall Adoption Rate.
This information is particularly valuable for license management, allowing you to identify if you have unused seats that could be reallocated or if you're approaching capacity and might need additional licenses.
Engagement
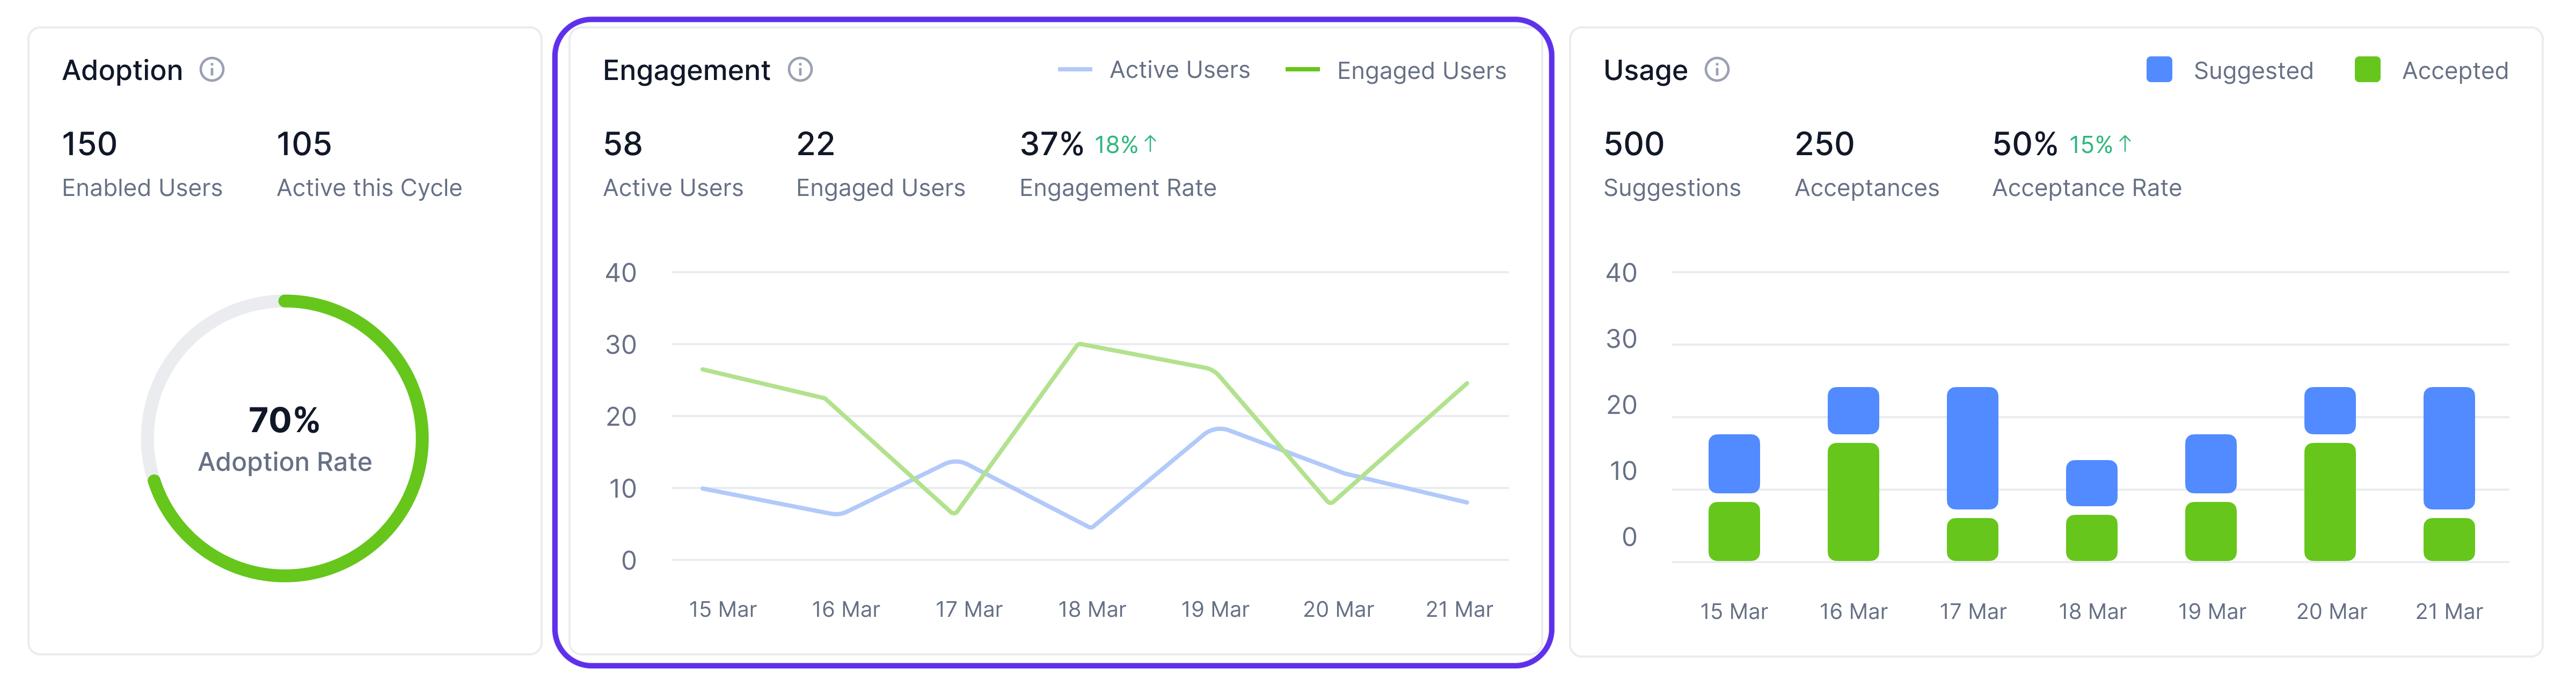
This section displays average daily engagement with Copilot across your organization for the selected time period. It helps you understand how actively your developers are using Copilot features.
The widget shows the average daily Active Users, Engaged Users, and calculates the Engagement Rate between them. This gives you a quick view of how many developers are not just receiving suggestions but actually engaging with Copilot's features.
The trend chart below visualizes daily Active and Engaged user counts throughout the selected date range, allowing you to identify usage patterns, trends, and potential drops in engagement that might require investigation.
Note: Averages are calculated over all days in the selected date range, including weekends, which may slightly lower per-day values if your organization doesn't typically work on weekends.
Usage
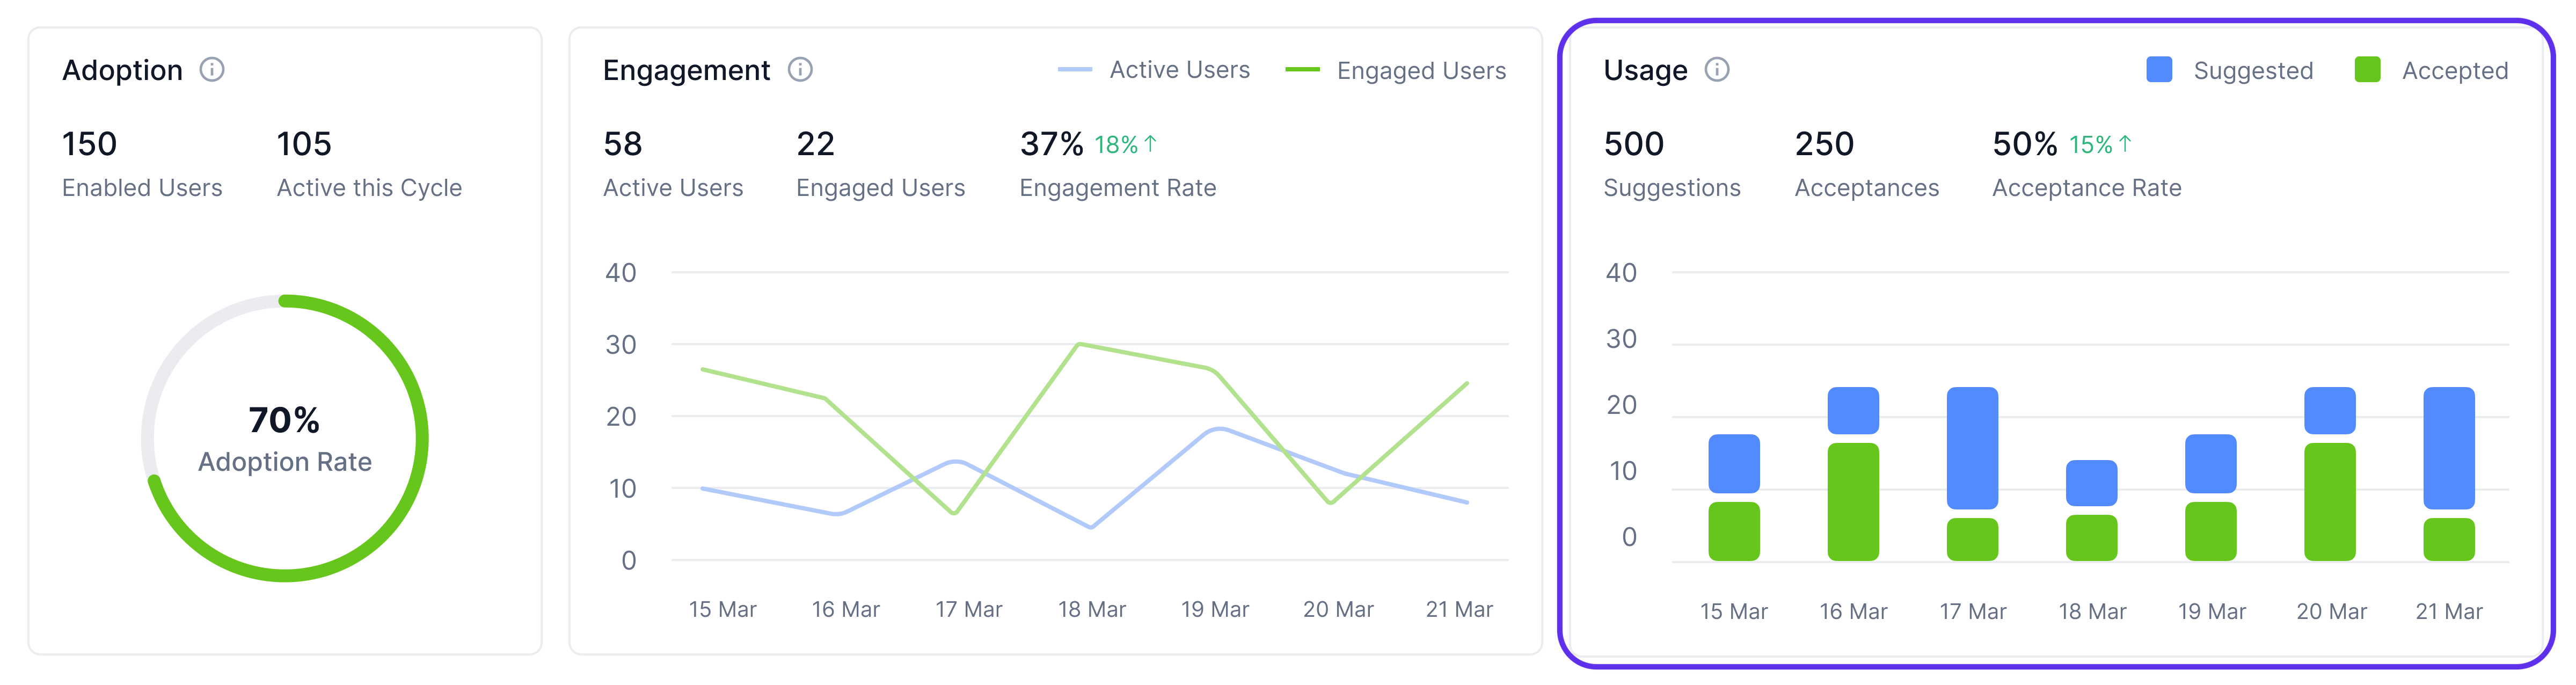
This visualization helps you understand where and how Copilot is being used across your organization. The grouped bar chart compares Suggestions, Acceptances, and calculates the Acceptance Rate, broken down by the dimension selected in the "Usage By" filter.
Depending on your selection, you'll see different insights:
- By Time: Track trends in suggestion volume and acceptance over days/weeks
- By Language: Identify which programming languages benefit most from Copilot
- By Editor: See which IDEs your developers prefer when using Copilot
- By Model: Compare performance between default and custom Copilot models
This flexibility allows you to drill down into specific aspects of Copilot usage to find actionable insights for your organization.
Github Teams-Level Breakdown
This table provides a detailed breakdown of Copilot metrics at the team level, helping you identify which teams are getting the most value from Copilot and which might need additional support or training.
For each GitHub team, you'll see:
- Average daily Active Users and Engaged Users
- Engagement Rate calculated from these values
- Total Suggestions and Acceptances
- Acceptance Rate for each team
This granular view helps you identify patterns across teams, recognize high-performing teams whose practices could be shared, and target teams with lower engagement for additional support.
Note: Like the engagement widget, team-level averages are computed over all days in the selected range, including weekends.
FAQs
Why don't I see data for the current day?
Metrics are processed once per day for the previous day, so the most recent data will be from yesterday.
Why are my Hatica Teams not visible in the Team-Level Table?
The Copilot Dashboard only displays GitHub Teams because the GitHub Copilot API specifically tracks data at the GitHub Team level. Teams created in Hatica (or Azure DevOps) won't appear here unless they are manually synced with corresponding GitHub Teams.
Why aren't all my GitHub Teams visible in the Team-Level Table?
We only display teams that have Copilot-related data to avoid unnecessary noise. If a GitHub Team with Copilot users isn't appearing, there are two likely reasons:
- Telemetry is not enabled in the team members' IDEs
- The GitHub API requires a minimum of 5 users with active Copilot licenses per team to track and provide Copilot data
Why can't I see our historical Copilot data?
GitHub's API has a limitation where it only provides Copilot metrics for the past 28 days. Unfortunately, this means Hatica cannot backfill data from before this 28-day window, regardless of how long you've been using Copilot. Once you connect Hatica and grant permissions, we'll begin storing all your Copilot data going forward, gradually building up your historical metrics over time. This is a GitHub API limitation that affects all analytics tools, not just Hatica.
Why is the adoption rate low even though our developers use Copilot regularly?
Check if telemetry is enabled in your developers' IDEs. Usage is only counted when telemetry is enabled.
Can I see individual user data?
No, GitHub's API only provides aggregated data for privacy reasons.