Services
The Services dashboard provides valuable insights into the performance and efficiency of software development and delivery processes. This dashboard offers a clear, objective way to measure and enhance the effectiveness of DevOps practices, ultimately leading to better software delivery outcomes and improved business performance.
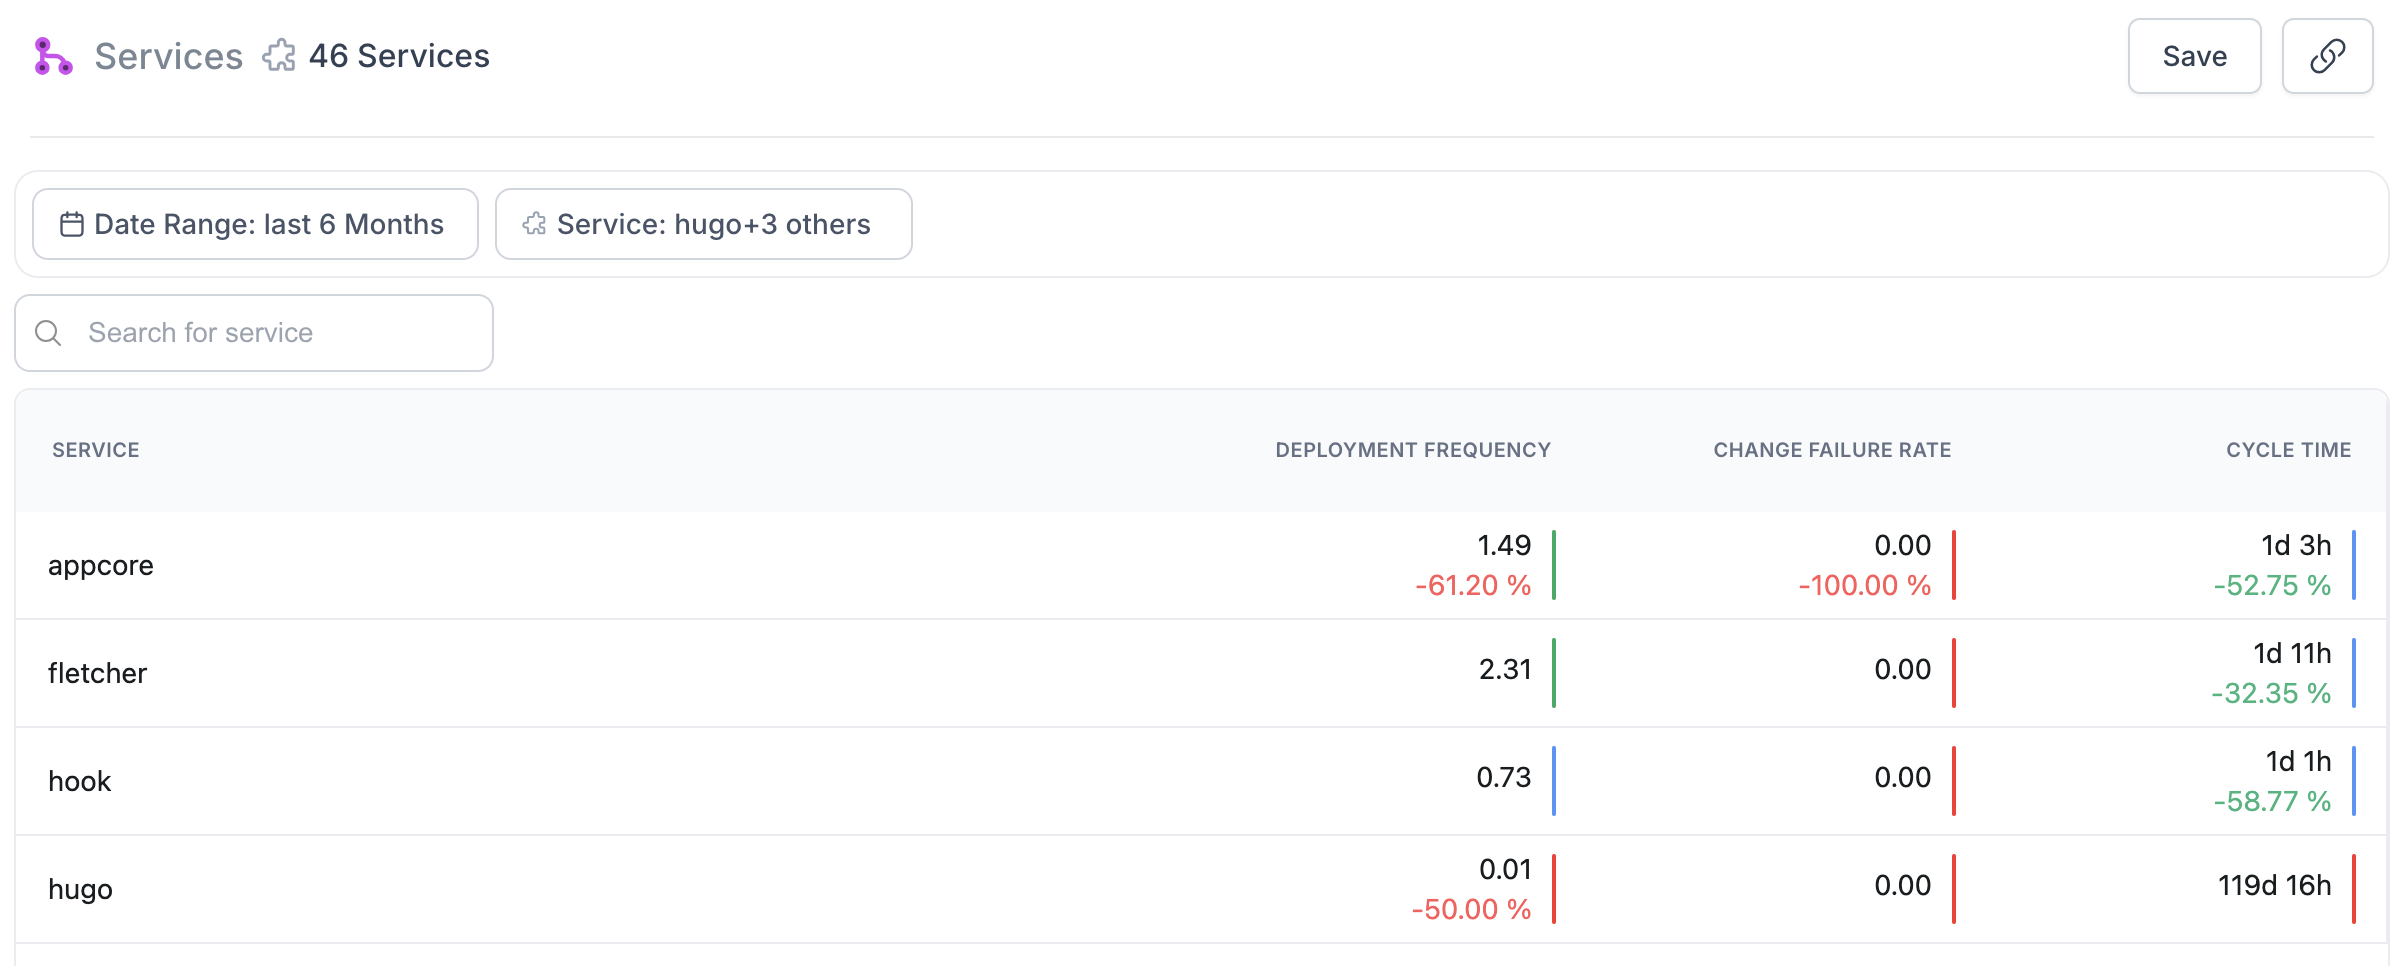
The Services overview page provide an at-a-glance summary of 3 key metrics for each service. For any given service on the table, you'll also see a bar against the metrics basis a comparison against industry benchmarks, and an increase/decrease indicator to indicate if we have improved/deteriorated over the selected time period.
Below are the three DORA metrics marked against each service:
- Deployment Frequency: Deployment Frequency is the ratio of total production deployments completed to the number of days in the selected date range. You can read more about the metric and industry benchmarks here (opens in a new tab).
- Change Failure Rate: Change Failure Rate is the percentage of deployments that cause a failure in production. Note that this is not a measure of deployments failures, but changes that cause the application for fail. You can read more about the metric and industry benchmarks here (opens in a new tab).
- Cycle Time: Cycle Time refers to the time it takes from the first code commit to production deployment. You can read more about the metric and industry benchmarks here (opens in a new tab).
Data Sources
- VCS Tools
- Incident Management Tools
- Project Management Tools - Jira
- CI/CD Tools
Filters
- Date Range
- Service
Use cases
-
Measure CI/CD & Release Effectiveness: DORA metrics help assess how effectively development and operations teams are working together. By tracking these metrics, organizations can identify strengths and areas for improvement in their DevOps practices.
-
Understand Deployment Frequency: Deployment Frequency indicate how often code changes are delivered to production. Regular and efficient deployments are linked to faster feature delivery and improved responsiveness to market needs.
-
Improve Total Cycle Time: Total Cycle Time referes to the time it takes from code commit to production deployment. Shorter lead times generally mean faster delivery of new features and bug fixes, leading to better user satisfaction and competitive advantage.
-
Reduce Change Failure Rate: By monitoring how often deployments result in failures or require fixes, organizations can work on improving code quality and testing processes. Lower change failure rates contribute to more stable and reliable software. CFR upto 15% is acceptable; if it's lower then the team can probably move faster. On the other hand, if it's higher then the team should move slower and focus on quality of what they're releasing.
-
Minimise Time to Restore Service: Faster recovery times reduce downtime and improve the overall reliability and resilience of services.
-
Drive Continuous Improvement: DORA metrics provide data-driven insights that help teams continuously refine their processes, adopt best practices, and achieve higher levels of performance and quality.
By focusing on metrics that impact deployment speed, stability, and efficiency, organizations can align their technical practices with broader business objectives such as faster time-to-market and customer satisfaction.