DORA Metrics Dashboard
The DORA dashboard acts as an extension to the Services Overview dashboard. This dash provides valuable insights into the performance and efficiency of software development and delivery processes along with the ability to drill down to a team and individual level.
Data Sources
- VCS Tools
- Incident Management Tools
- Project Management Tools - Jira
- CI/CD Tools
You can check out all apps supported by Hatica here: https://www.hatica.io/connectors/ (opens in a new tab)
Available filters
- Date Range Picker
- Services
- Individuals
- Teams
- Repos
Walkthrough
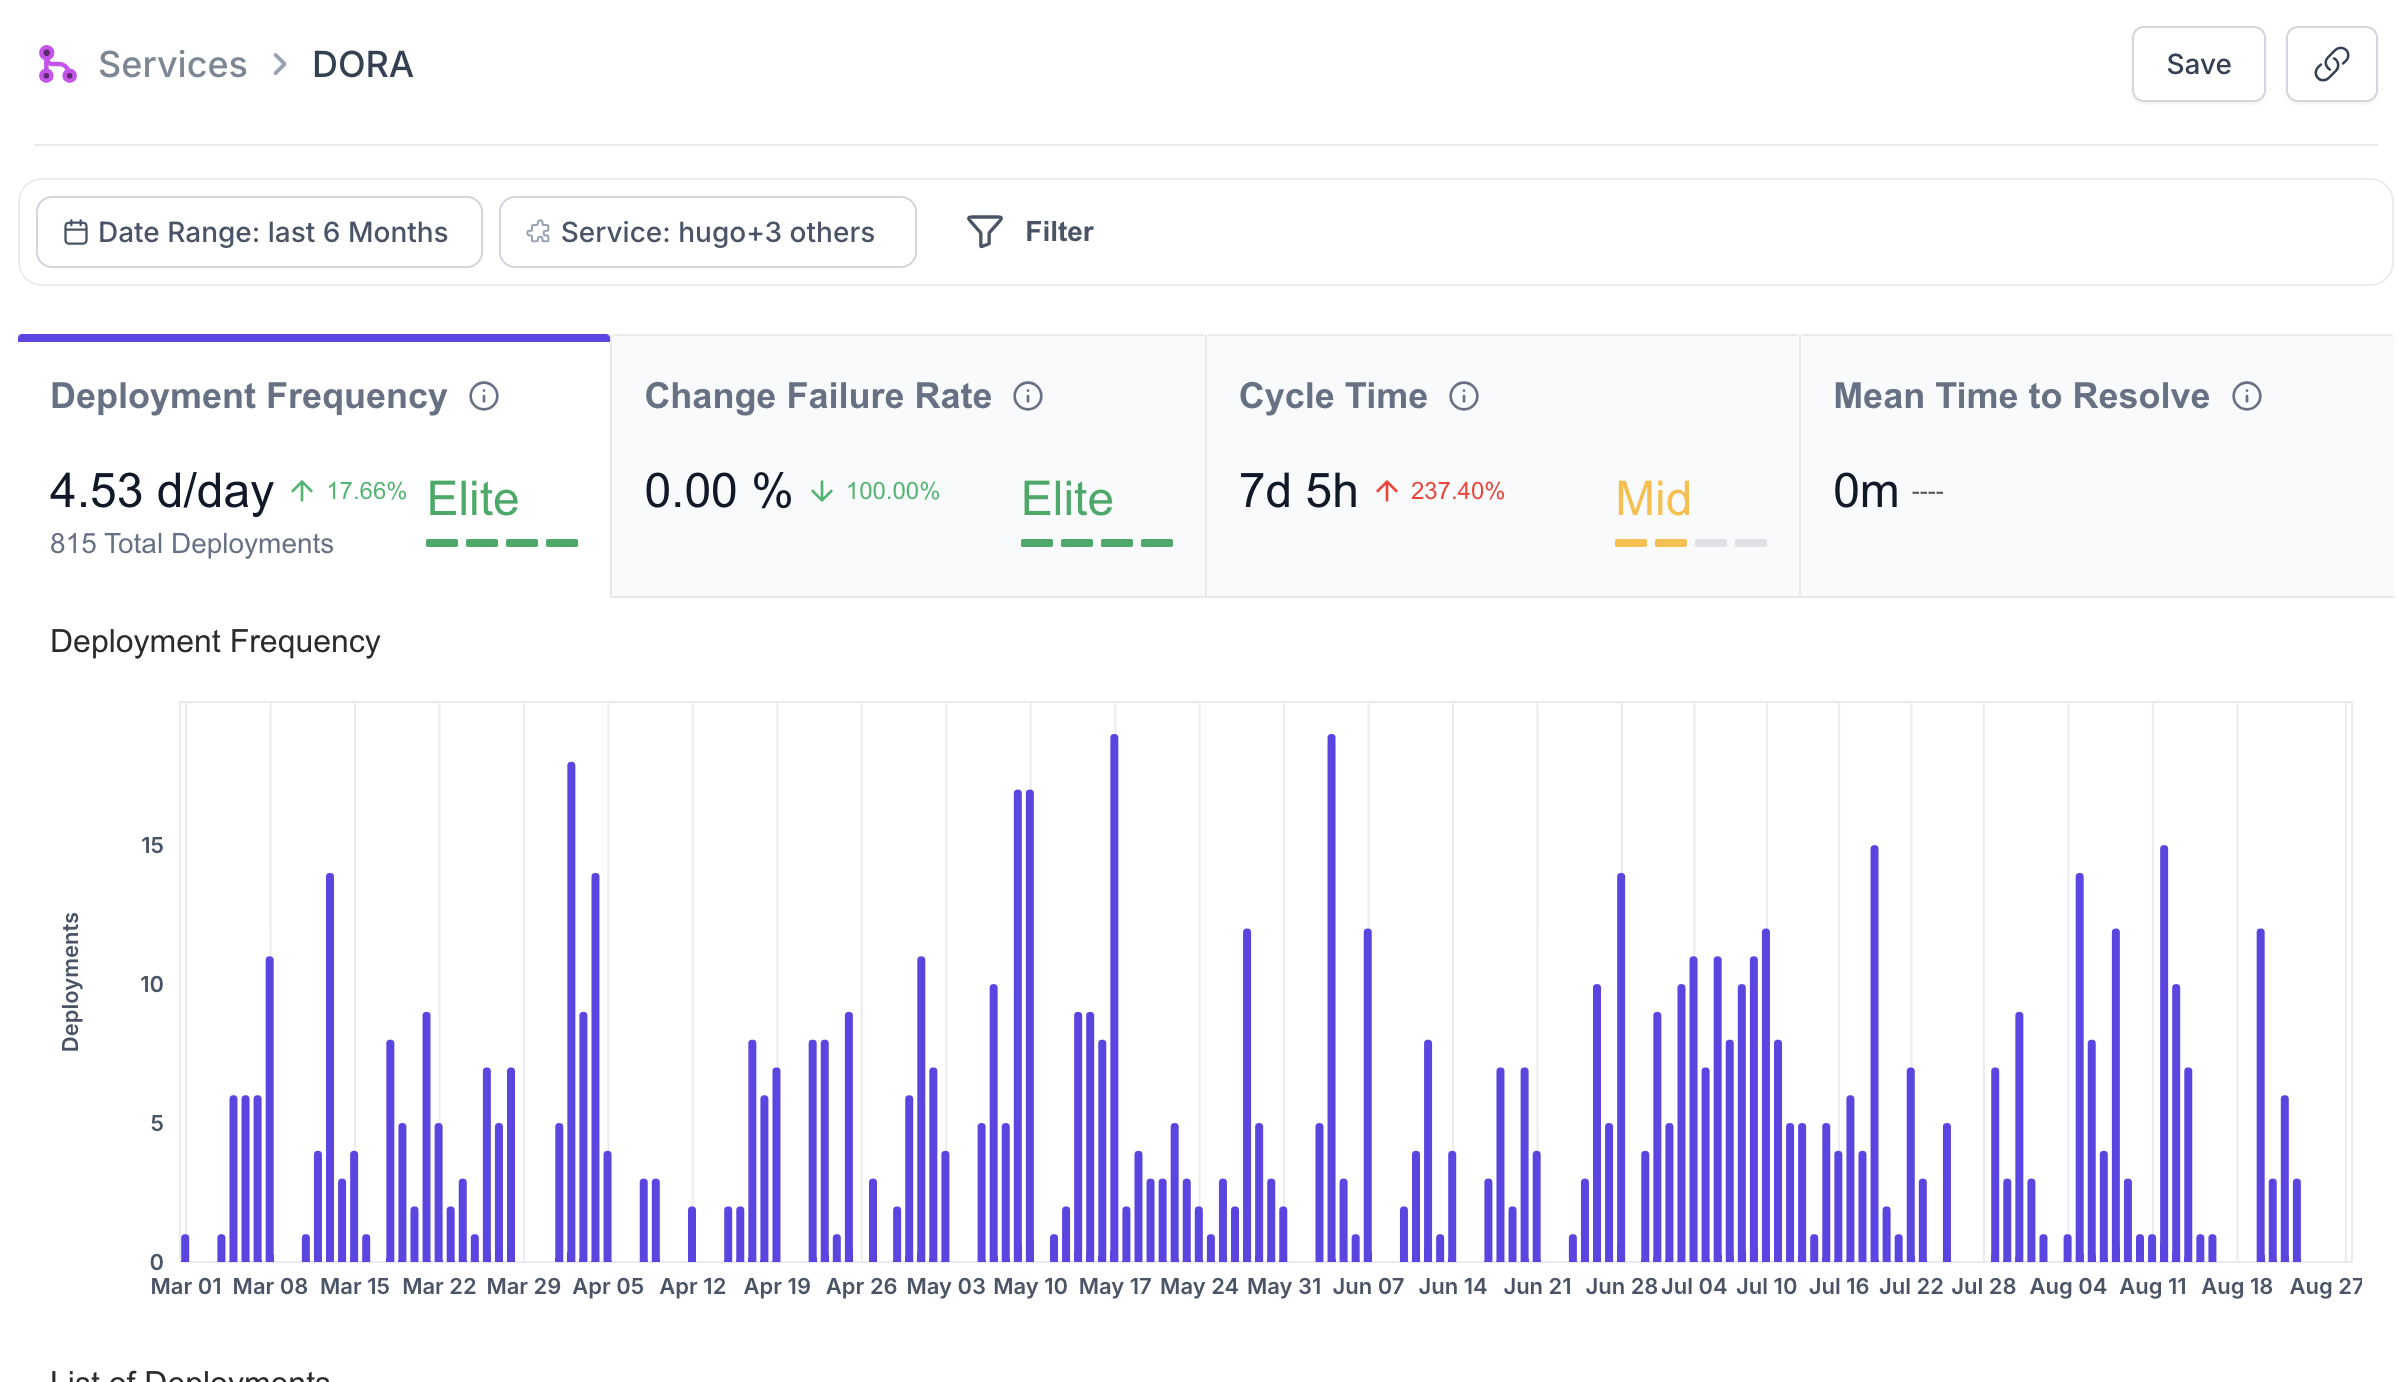
As mentioned earlier, this dashboard builds on the information you see on the Services overview dashboard. With the added functionality to drill down and analyse all four metrics for the selected services/teams/individuals. To reiterate, the four metrics are:
- Deployment Frequency: Deployment Frequency is the ratio of total production deployments completed to the number of days in the selected date range. You can read more about the metric and industry benchmarks here (opens in a new tab).
- Change Failure Rate: Change Failure Rate is the percentage of deployments that cause a failure in production. Note that this is not a measure of deployments failures, but changes that cause the application for fail. You can read more about the metric and industry benchmarks here (opens in a new tab).
- Cycle Time: Cycle Time refers to the time it takes from the first code commit to production deployment. You can read more about the metric and industry benchmarks here (opens in a new tab).
- Mean Time to Restore: Mean time to restore (MTTR) is a metric that measures how long it takes to recover from a production incident or outage. You can read more about the metric and industry benchmarks here (opens in a new tab).
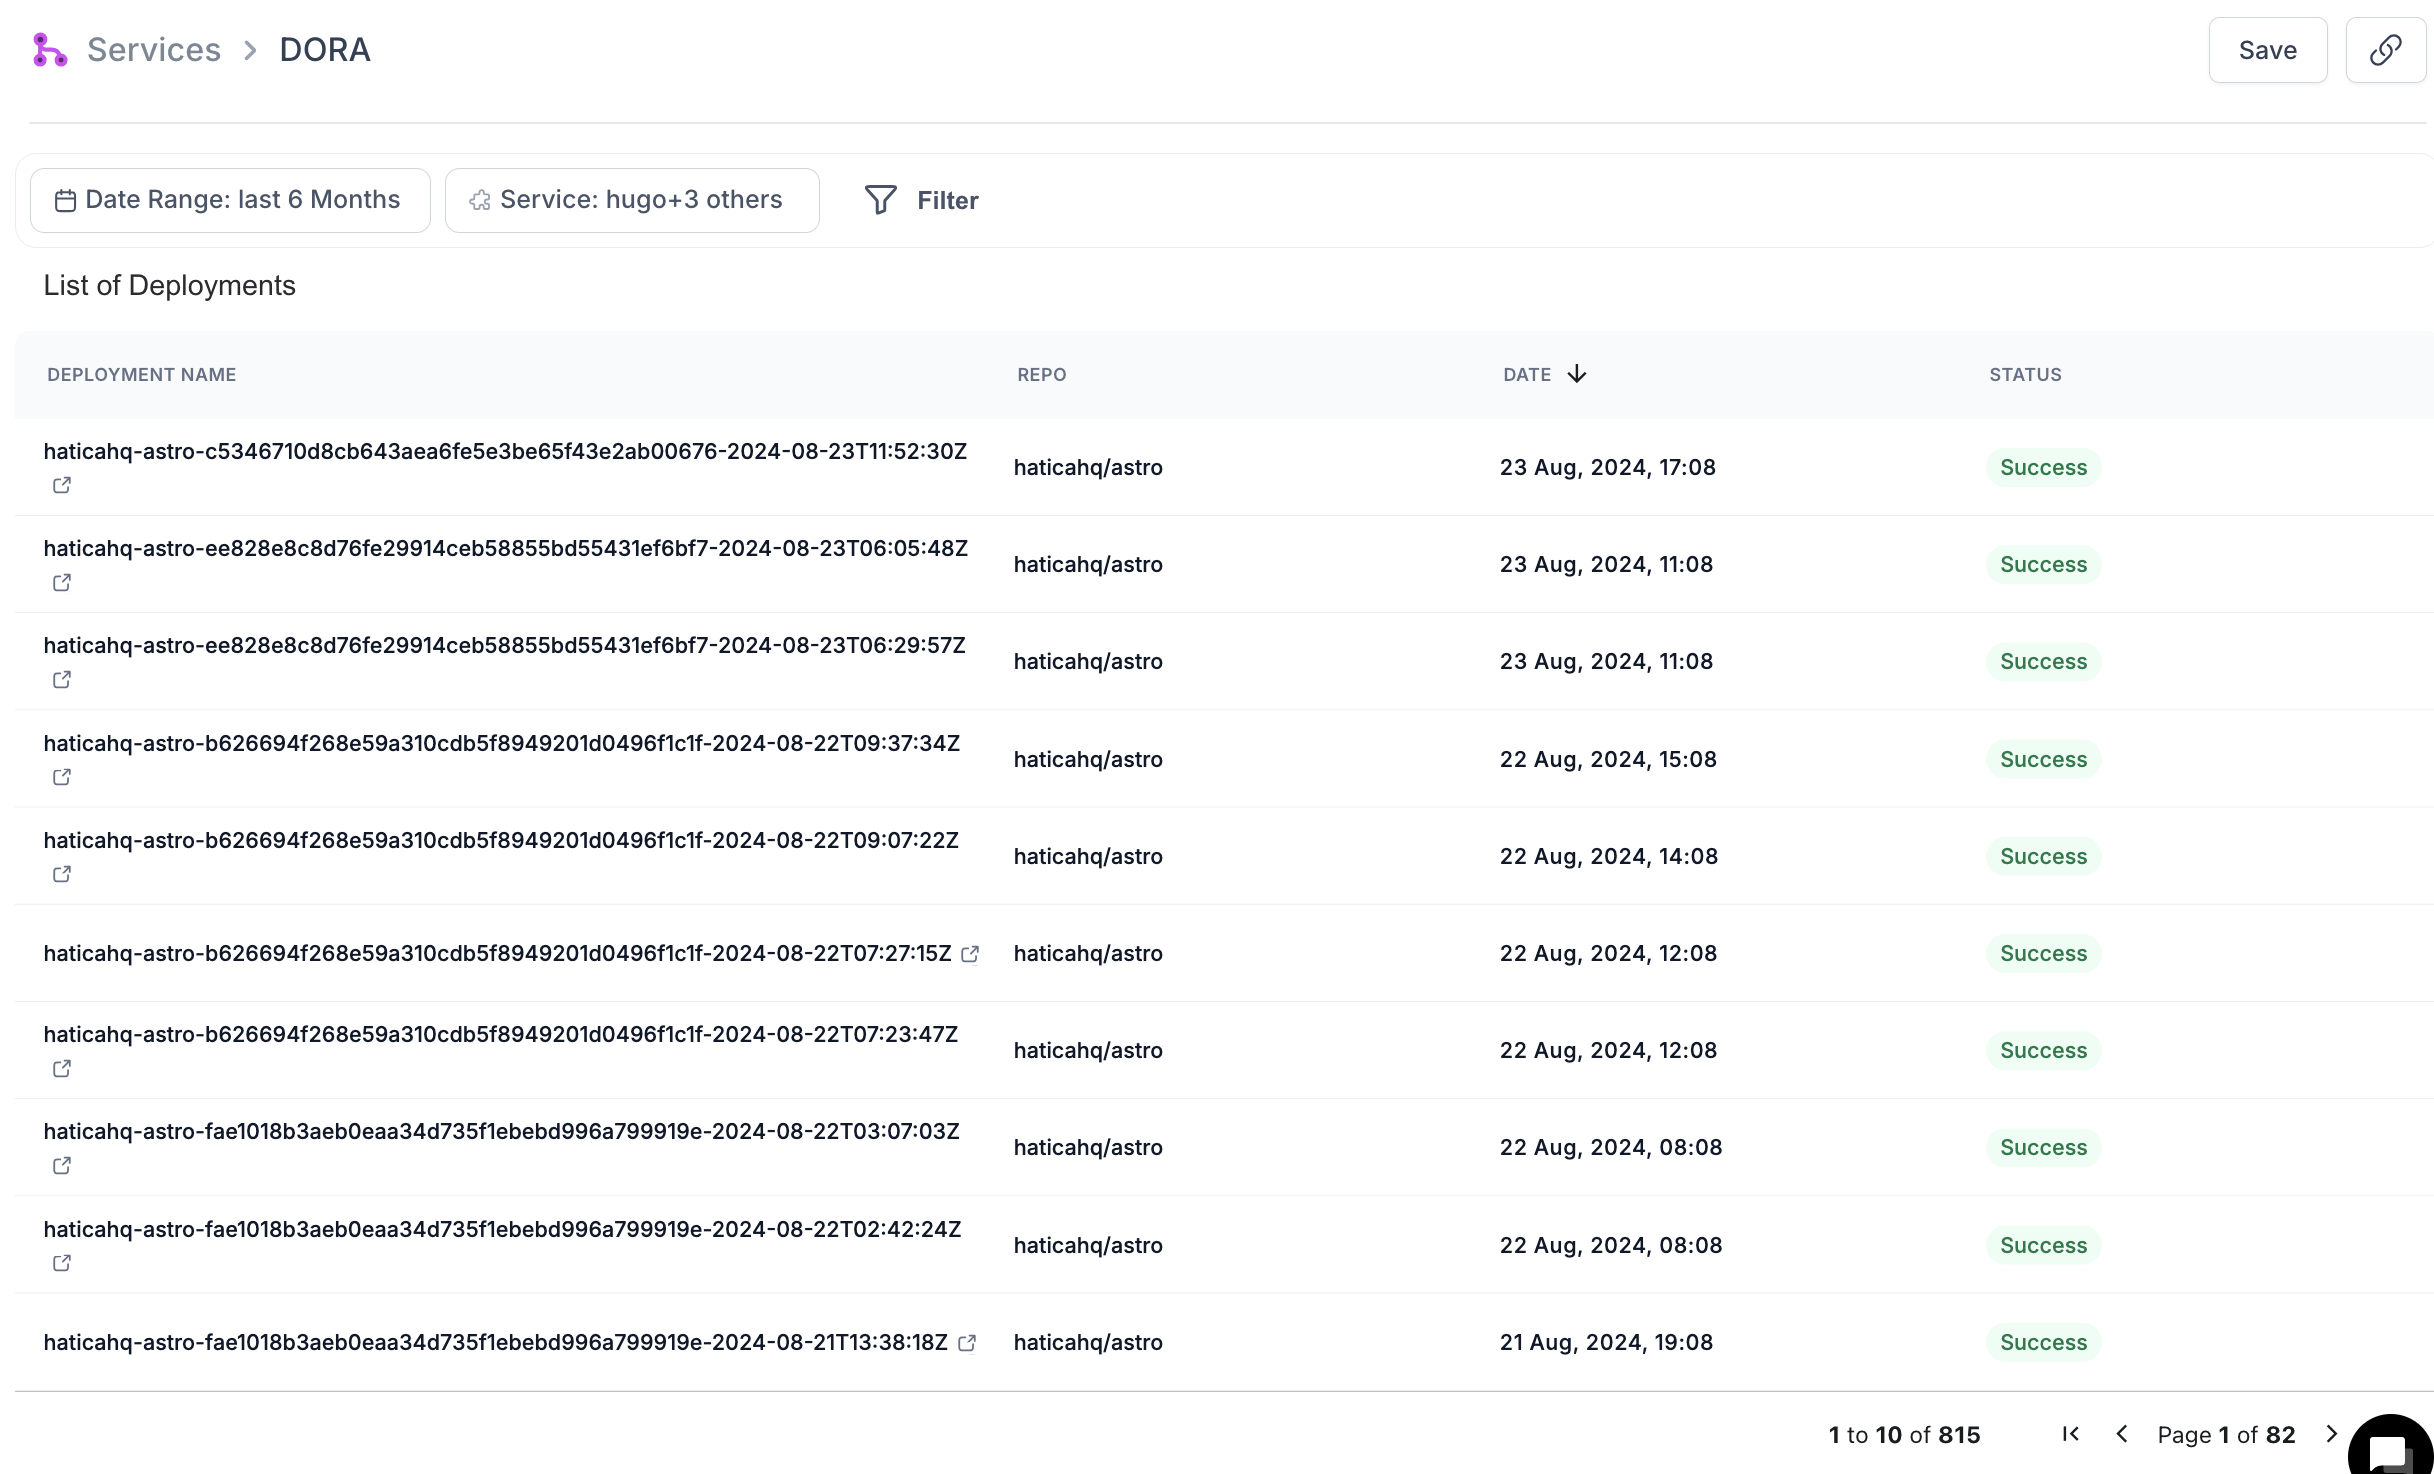
Upon clicking on each of the 4 metrics' tabs, you can also see a histogram for the metric spread across the date range selected. You also get a table view of all the deployments/incidents/PRs that align with the filters selected.
How to use the DORA dashboard
-
Measure CI/CD & Release Effectiveness: DORA metrics help assess how effectively development and operations teams are working together. By tracking these metrics, organizations can identify strengths and areas for improvement in their DevOps practices.
-
Understand Deployment Frequency: Deployment Frequency indicate how often code changes are delivered to production. Regular and efficient deployments are linked to faster feature delivery and improved responsiveness to market needs.
-
Improve Total Cycle Time: Total Cycle Time referes to the time it takes from code commit to production deployment. Shorter lead times generally mean faster delivery of new features and bug fixes, leading to better user satisfaction and competitive advantage.
-
Reduce Change Failure Rate: By monitoring how often deployments result in failures or require fixes, organizations can work on improving code quality and testing processes. Lower change failure rates contribute to more stable and reliable software. CFR upto 15% is acceptable; if it's lower then the team can probably move faster. On the other hand, if it's higher then the team should move slower and focus on quality of what they're releasing.
-
Minimise Time to Restore Service: Faster recovery times reduce downtime and improve the overall reliability and resilience of services.
-
Drive Continuous Improvement: DORA metrics provide data-driven insights that help teams continuously refine their processes, adopt best practices, and achieve higher levels of performance and quality.
By focusing on metrics that impact deployment speed, stability, and efficiency, organizations can align their technical practices with broader business objectives such as faster time-to-market and customer satisfaction.
How DORA metrics are calculated for out of Sync repositories
The SLA for data sync is 48 hours for repositories on an incremental basis. Initial sync can take up to 3 days and does not have an SLA, as it depends on the number and size of repositories and varies with each organization. The data sync does not restrict you from sending deployment data via any supported deployment tracking mechanisms, including the API. If the repository is not synced, the pull request being marked as deployed may not yet be available in Hatica, depending on the sync time and PR creation. Once the repository sync is completed, the pull request will appear in Hatica. Hatica will then reprocess the deployment data and update the pull request status to deployed.
How are duplicate deployments handled
If the deployment is reporting the same commit multiple times, the deployment will be counted multiple times. However, for cycle time calculation, only the first deployment will be considered.