Metrics
As the name suggests, this dashboard will give you an idea about the selected team’s metrics for the configured timeframe on a team as well as individual level.
There are two broad representations on this dashboard:
- List view → This view aggregates data for the entire team and shows how the team fares against industry benchmarks.
- Grid view → This view allows you to view individual level data for selected metrics for your team members.
List view
As mentioned above, this view aggregates data on a team level. For the selected team, you can further filter for:
- Repos
- Specific individual(s)
- Date range
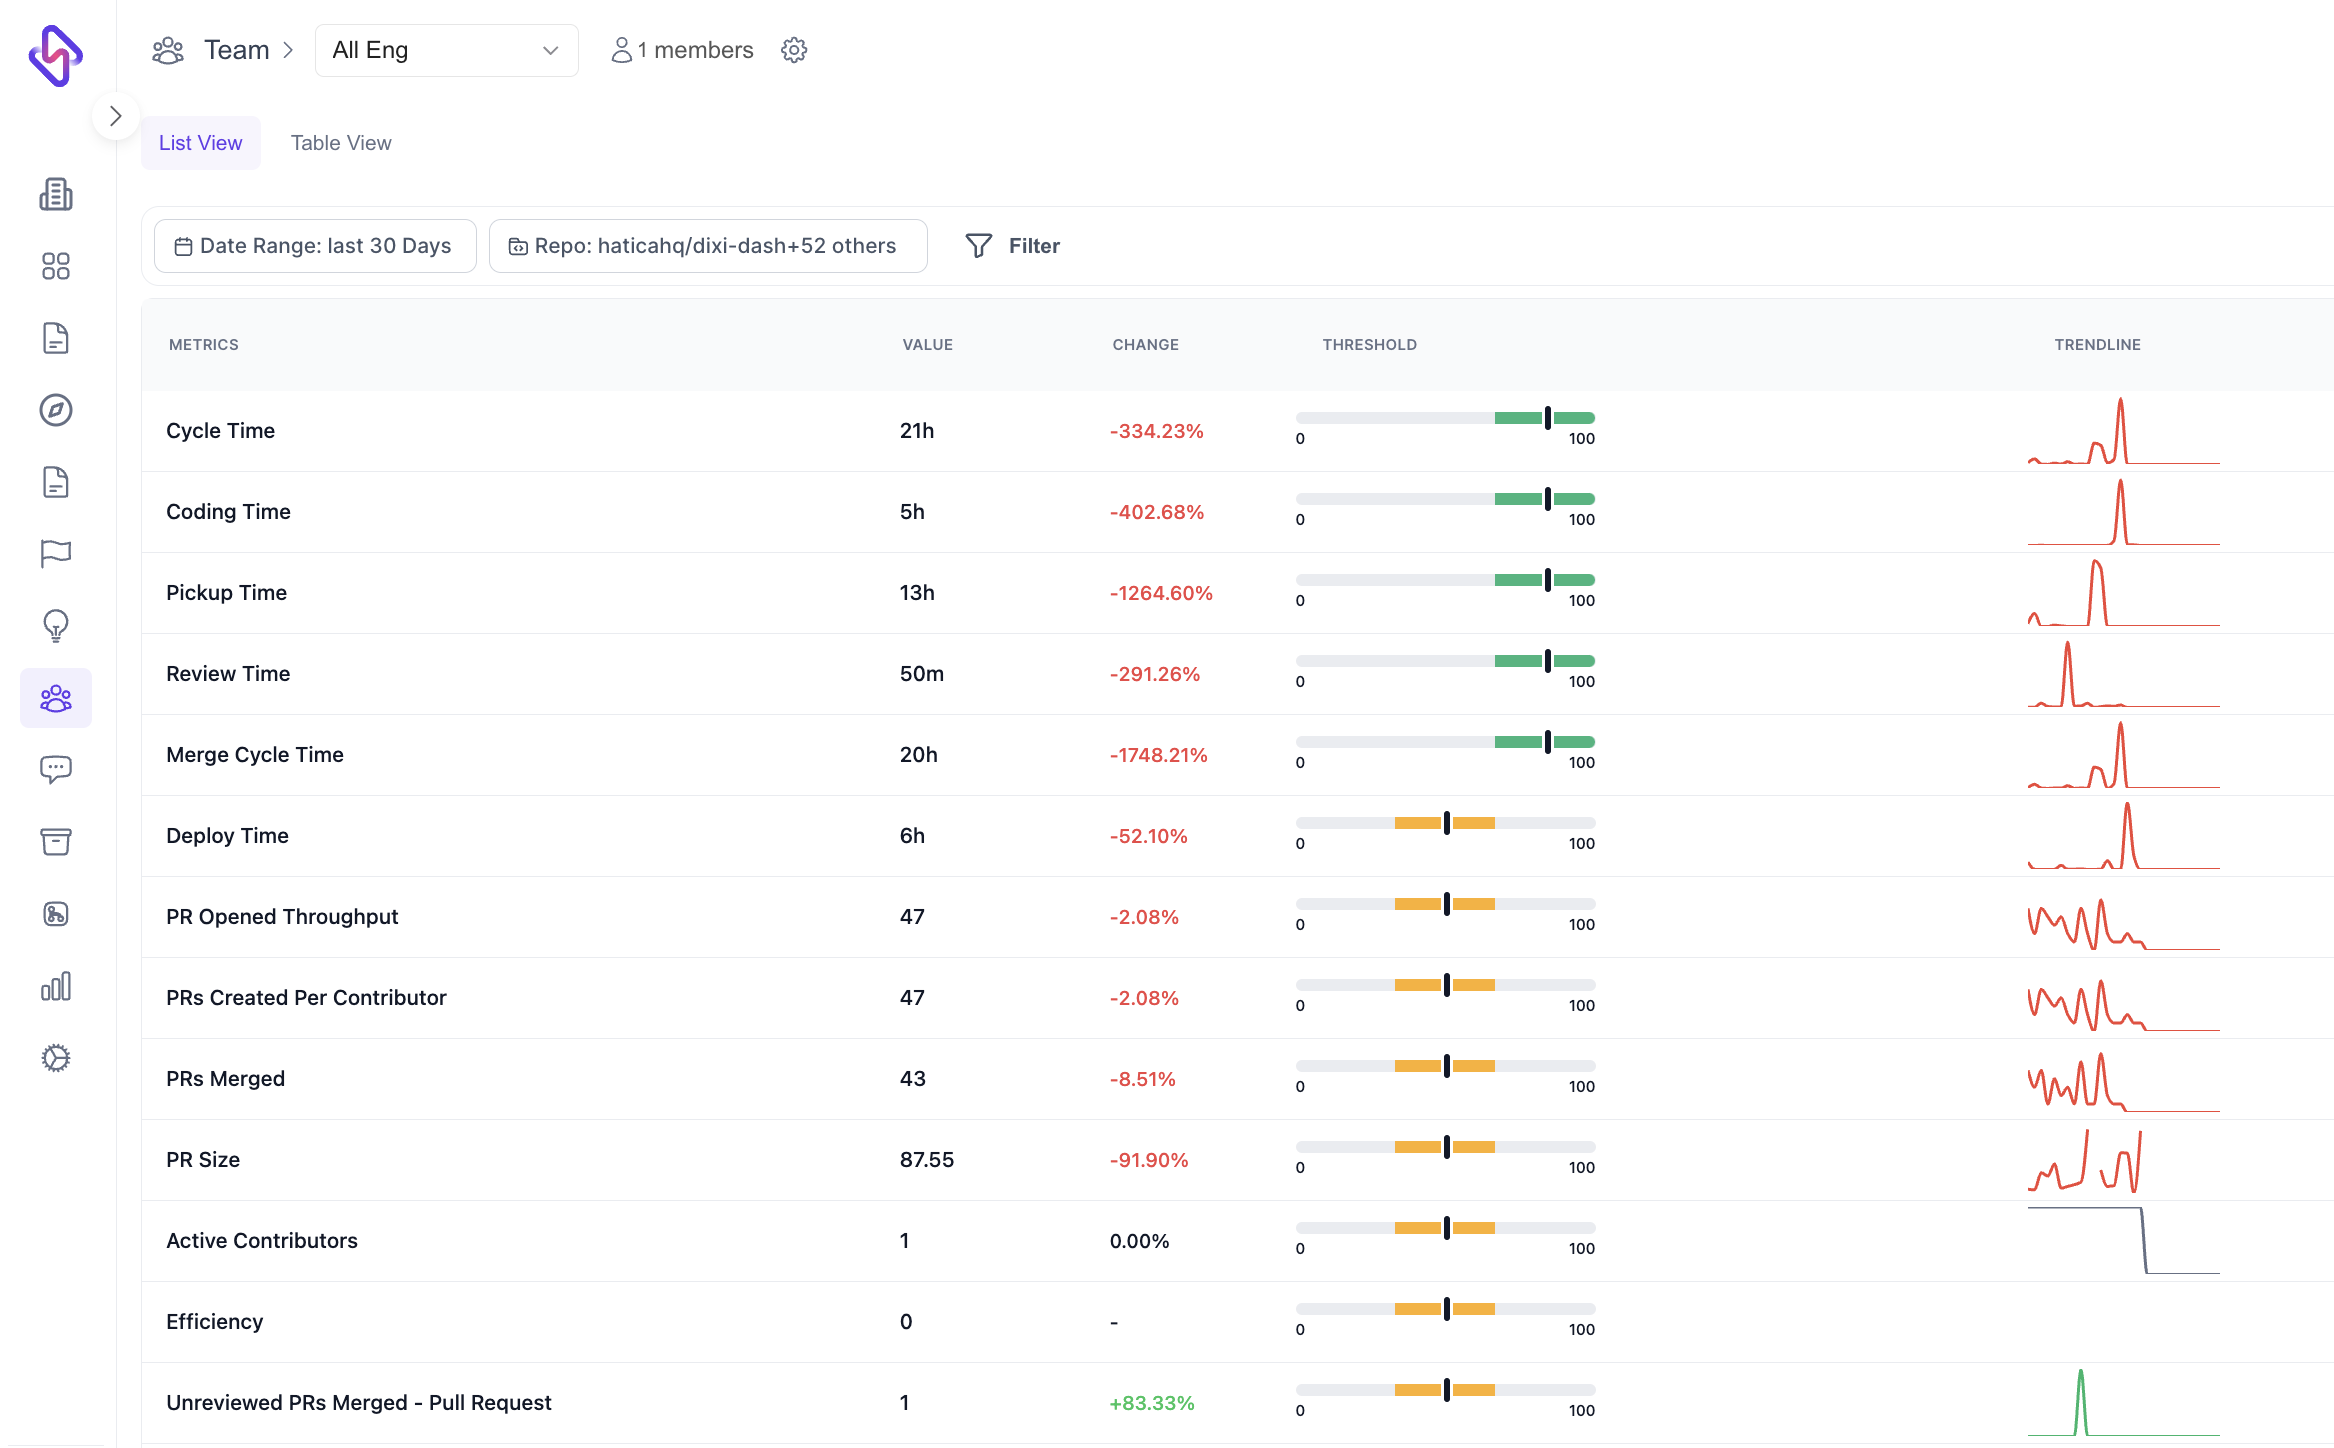
There are 5 headers on the List view dashboard:
- Metric name
- Value
- % Change compared to the last period. (For example, if the current timeline indicates the month of March’24, the metric value for the selected time frame will be compared to Feb’24, and the colour/direction will indicate increase/decrease in the value for that metric).
- Threshold - Green/Yellow/Red will give you an idea about how the metric fares against industry standards set as thresholds.
- Trend line - Gives you a trendline chart for the selected timeframe.
Clicking any of the rows will open a sidebar to give you more context.
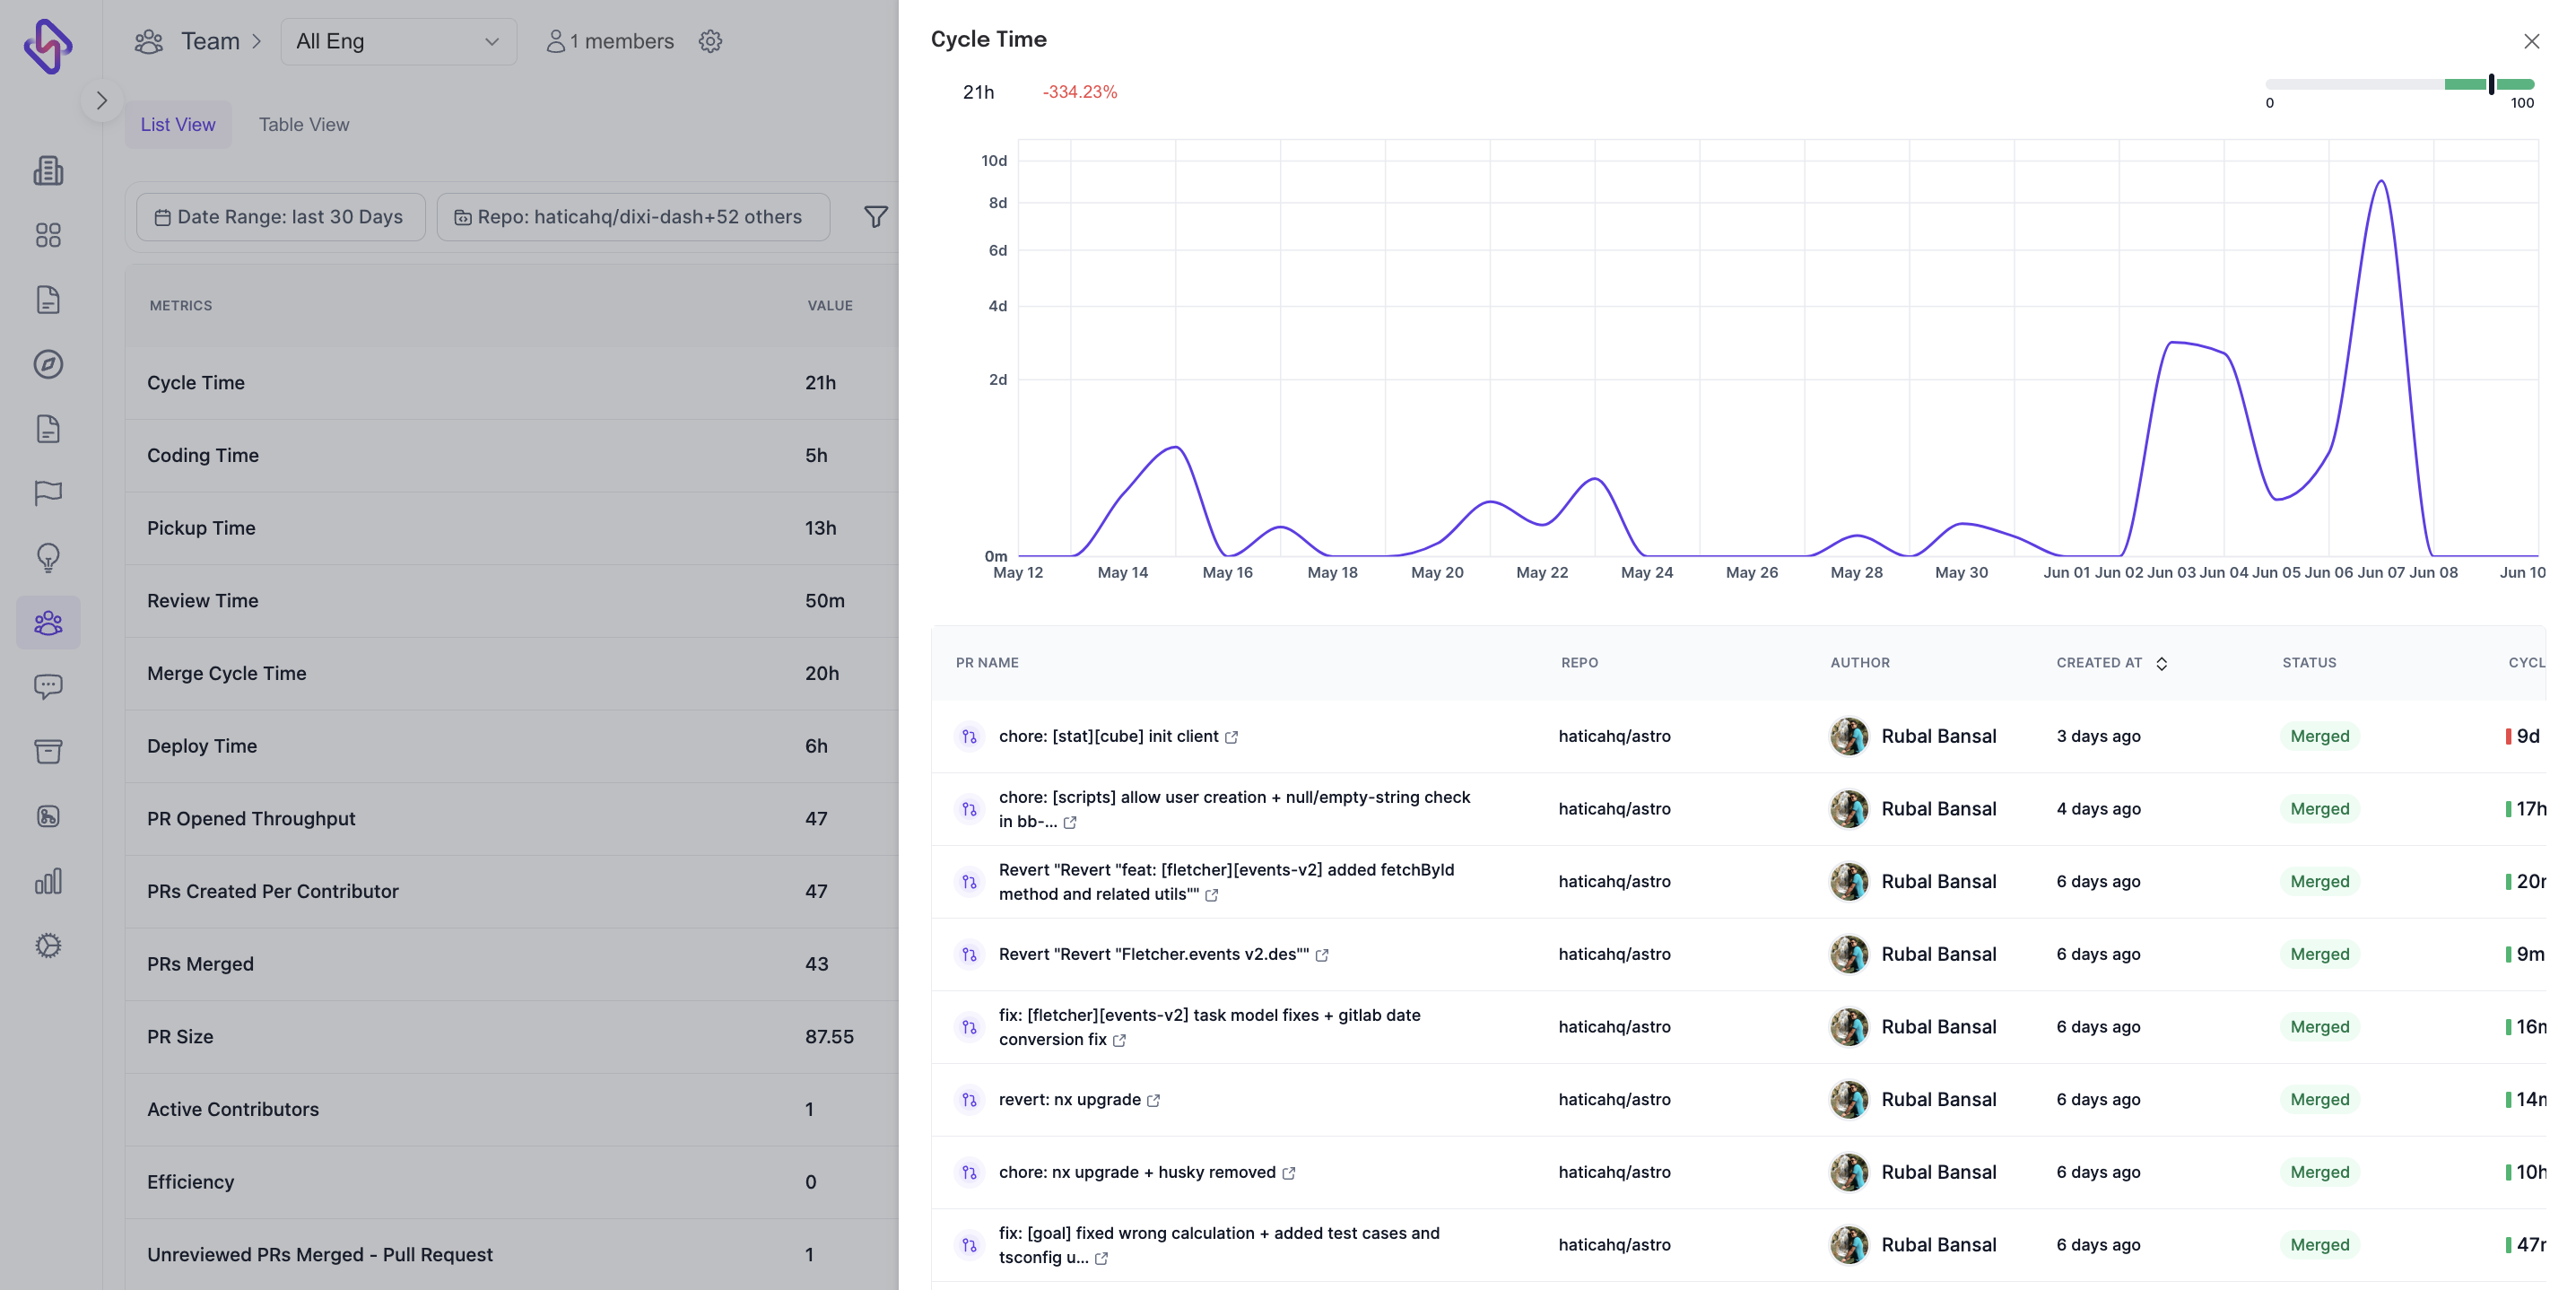
Table View
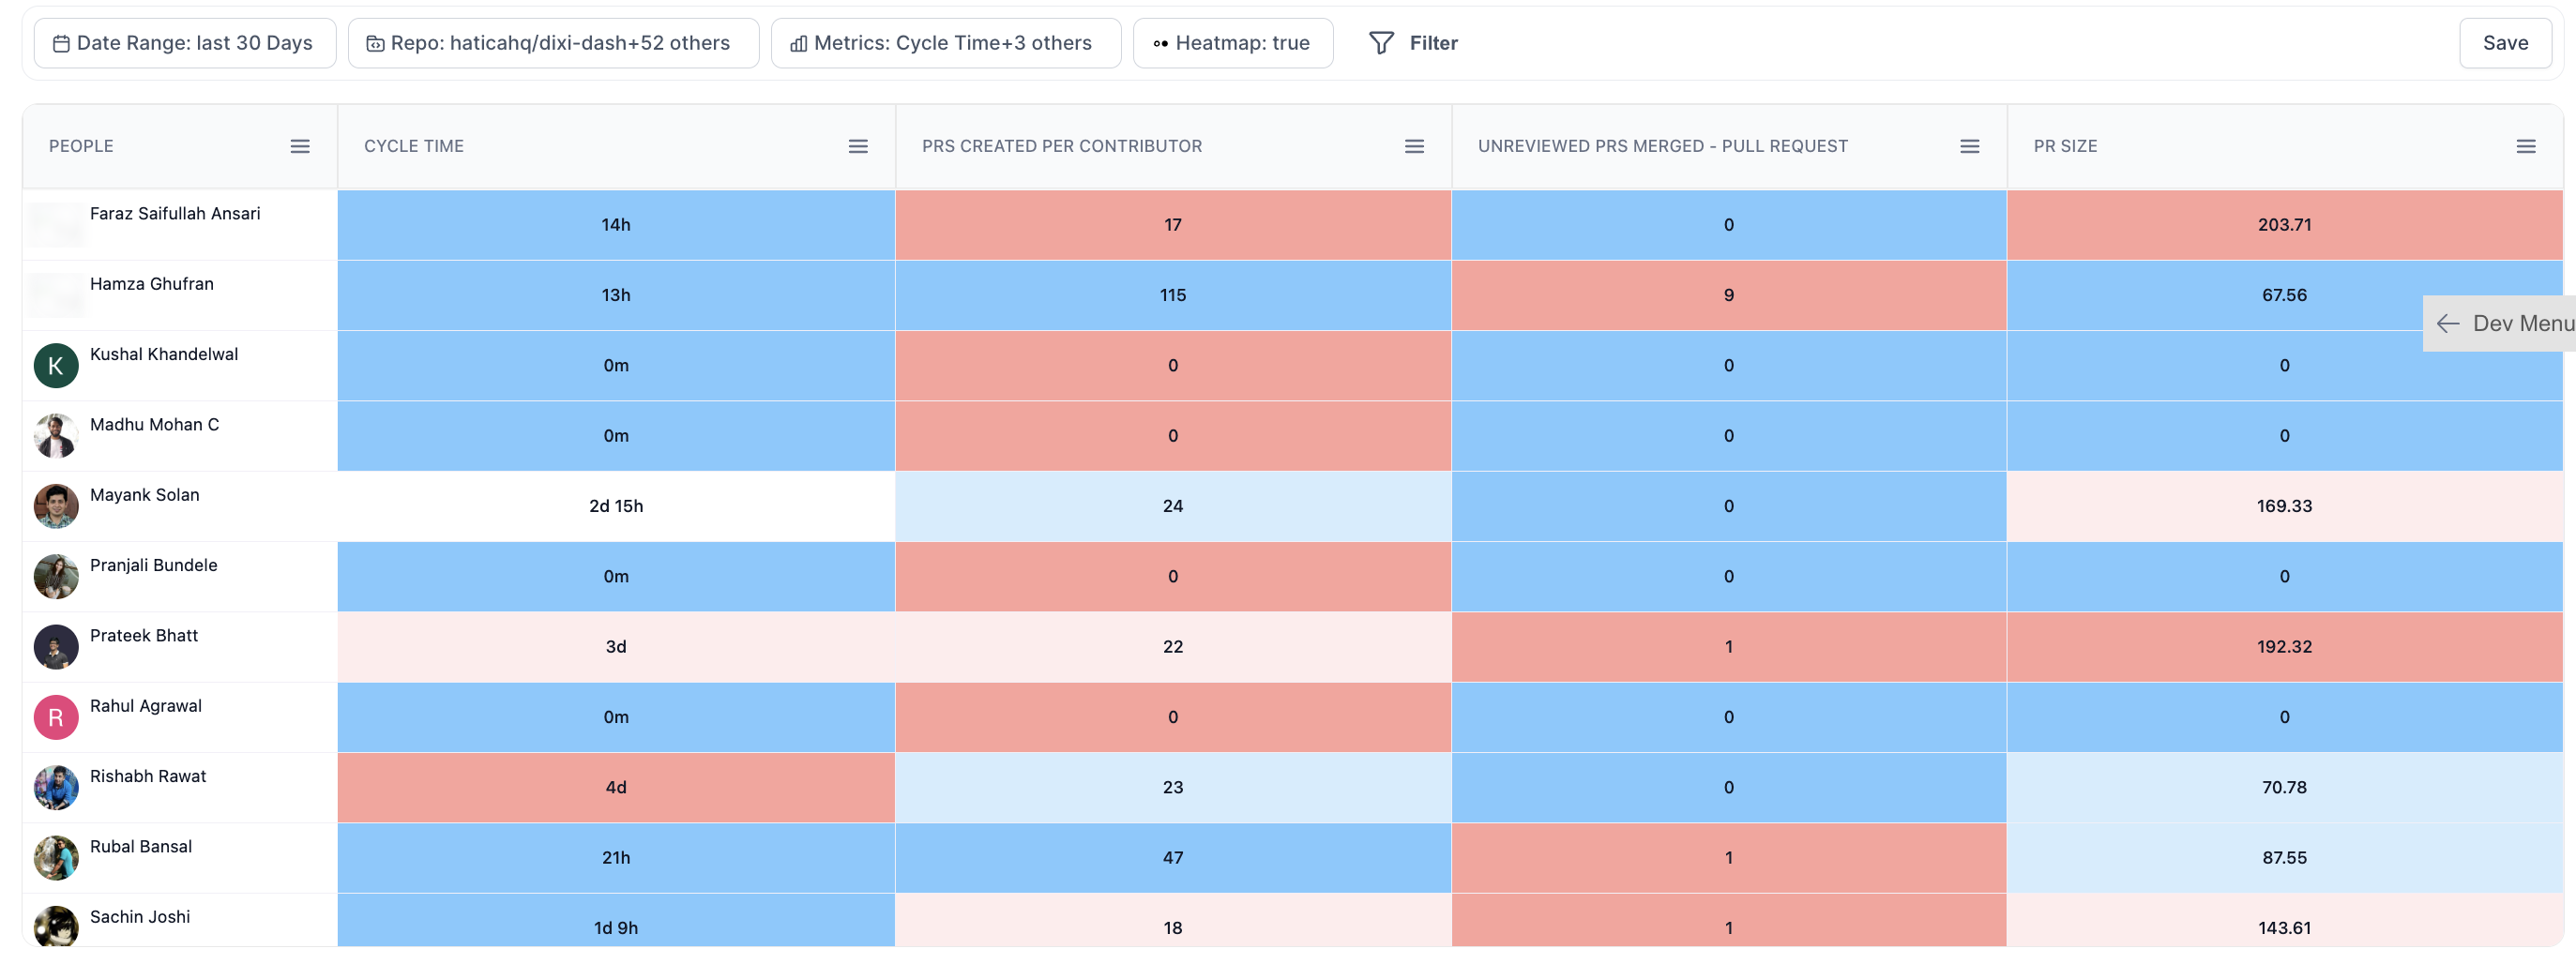
While the List view dashboard empowers you to view aggregated data, the Table view enables you to take a look at these metrics on an individual level. For the selected team, you can further filter for:
- Individuals
- Metrics
- Repos
- Enable/Disable heatmaps (blue/red assigned based on comparison with the industry benchmark)
- Date range
Clicking on the hamburger icon next to metric names (column headers) will allow you to control the following actions:
- Sort ascending/descending
- Enable/disable trendlines
- Set a custom threshold
Usecases
- List view
- View aggregated metric data for your selected team.
- View data for a specific individual one at time.
- Compare selected team/individual against industry benchmarks.
- Table view
- View aggregated metric data for all/selected individuals in the team.
- Identify high/weak performing individuals within the team.
- Understand areas of improvement for individuals against industry standards.