Team Velocity
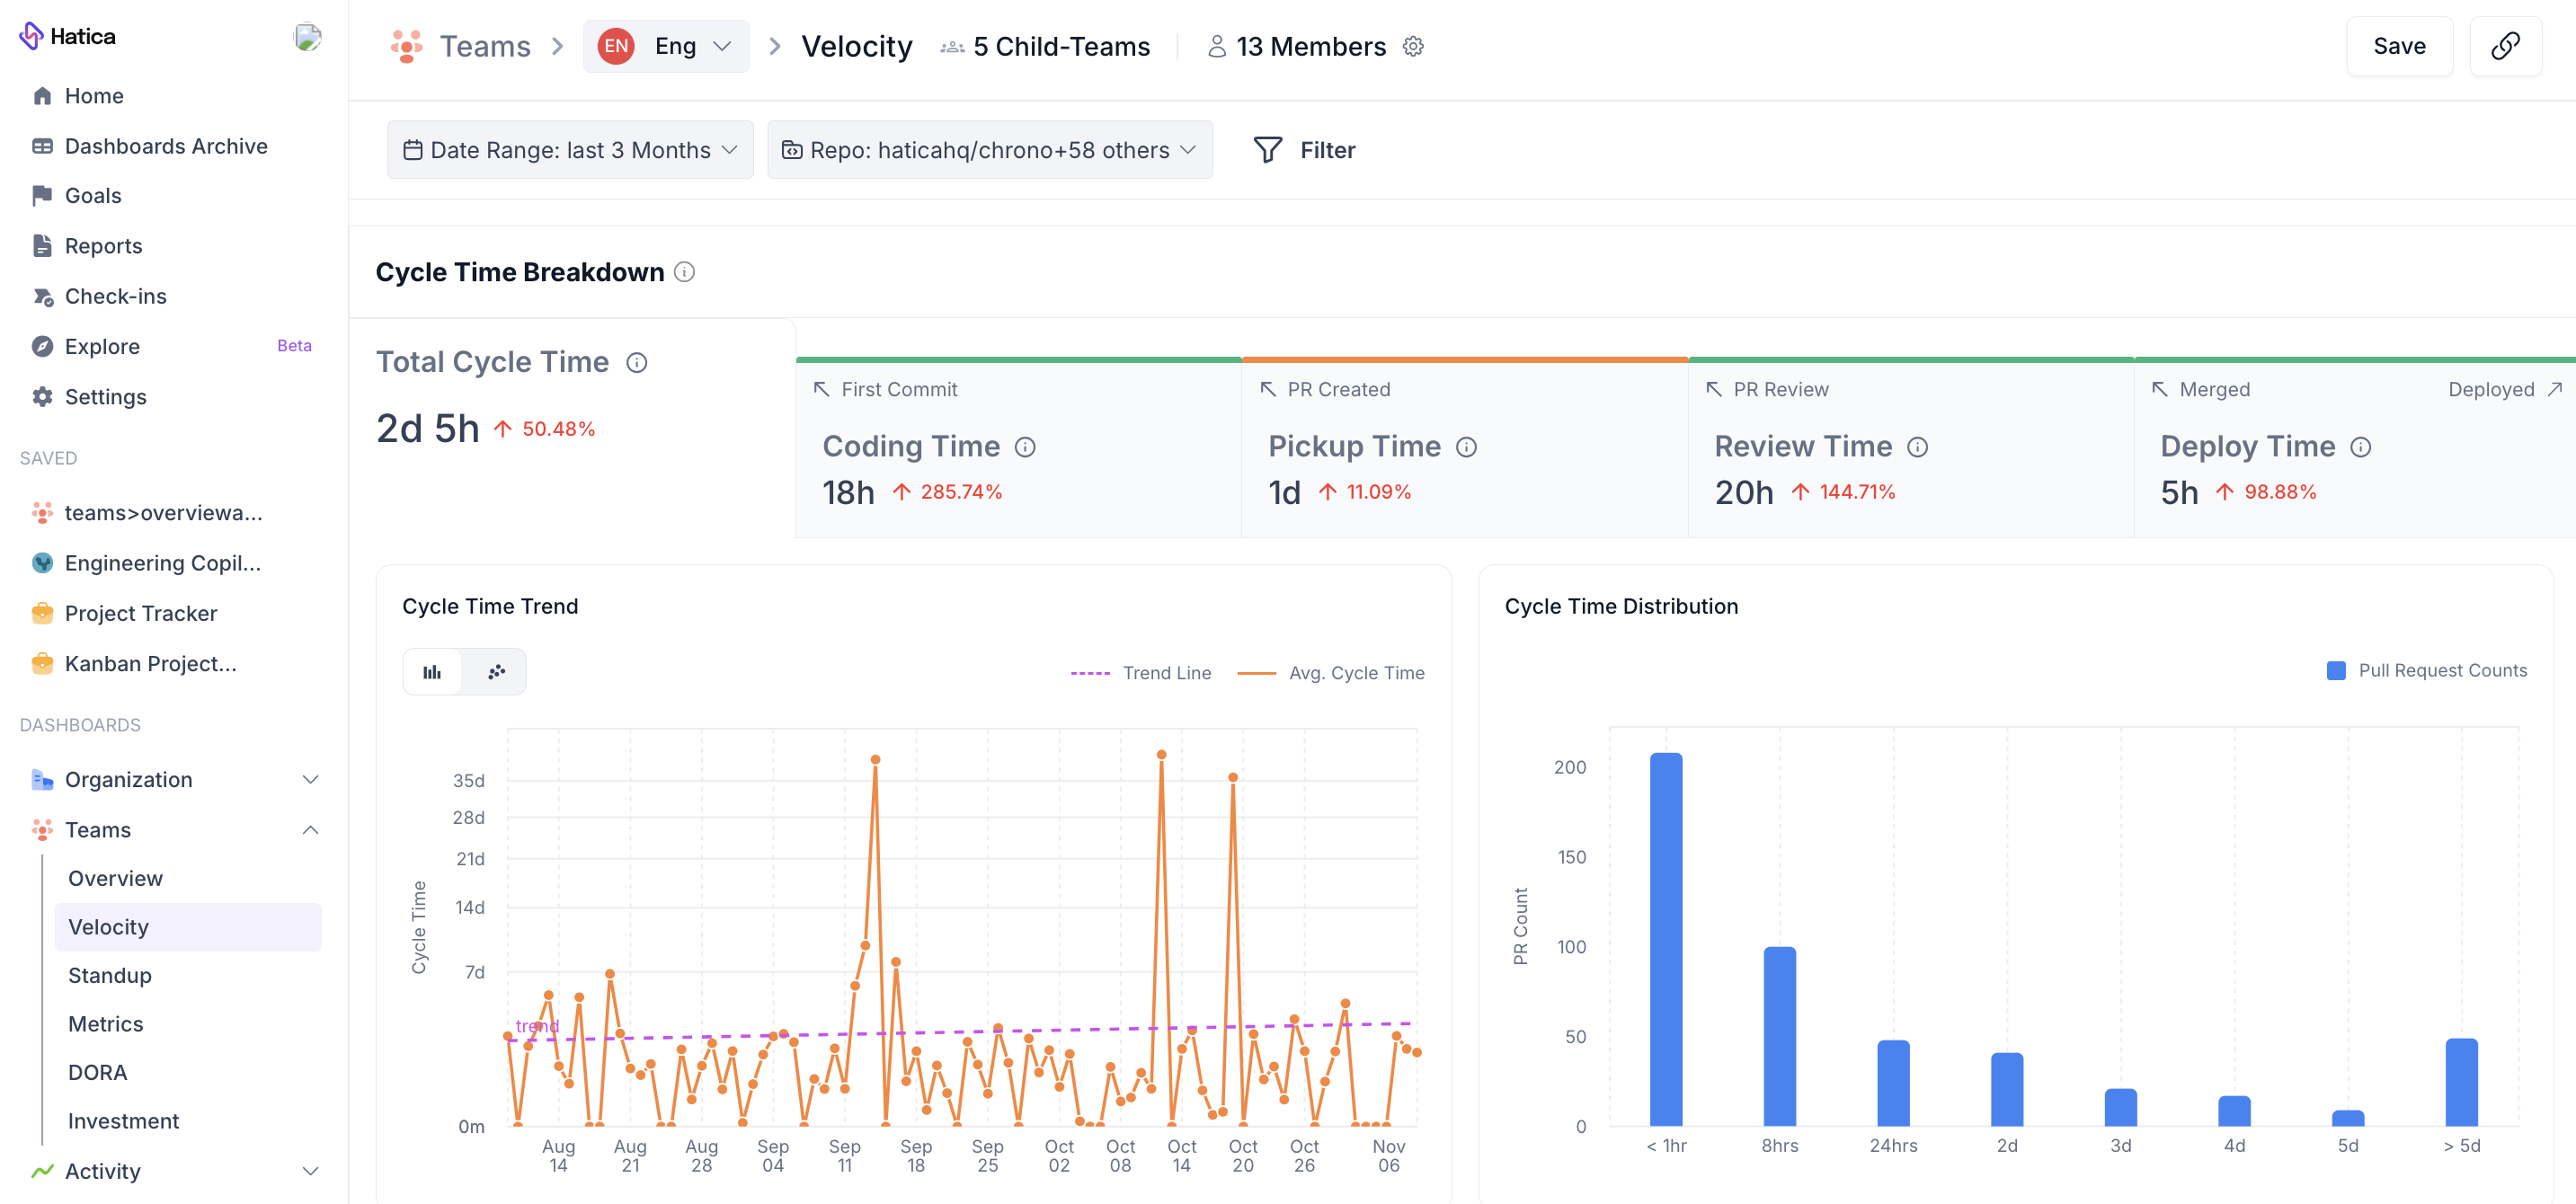
The Team > Velocity dashboard represents a set of key metrics that summarise the total cycle time of the entire software engineering lifecycle for the selected team. Cycle time is one of the most widely tracked metrics across engineering teams and is a great way to identify bottlenecks in the development process. Since cycle time begins with the first commit and ends with Production deployment, it gives a complete and holistic view of all the steps in the process; enabling you to understand what's working, and what's not.
Video walkthrough
Data source
- Git/VCS apps
- CI-CD tools
Filters
- Date Range Picker: Select a specific time period to view relevant metrics.
- Individual Picker: Narrow down the data by selecting individual team members.
- Repository: Drill down to specific Git repositories to analyze PR activity at the repository level.
- Base Branch: Filter PRs by their base branch, allowing you to view PRs cut from or merged to a specific branch.
- Status: Filter PRs by their current status, including:
- Draft: PRs still in draft mode, typically undergoing initial development.
- Open: PRs that have been moved from draft to the ready-for-review state.
- Merged: PRs that have been approved and merged into the base branch.
- Abandoned: PRs that were closed without being merged.
- Deployed: PRs that have completed the entire lifecycle, from coding to deployment in production.
The default branch names in GitHub & GitLab <v14.0 is main and master in case of Bitbucket & Gitlab v14.0
Cycle Time Breakdown
The overall software development lifecycle can be broken down into multiple stages adding up to what we call Total Cycle Time. The stages are:
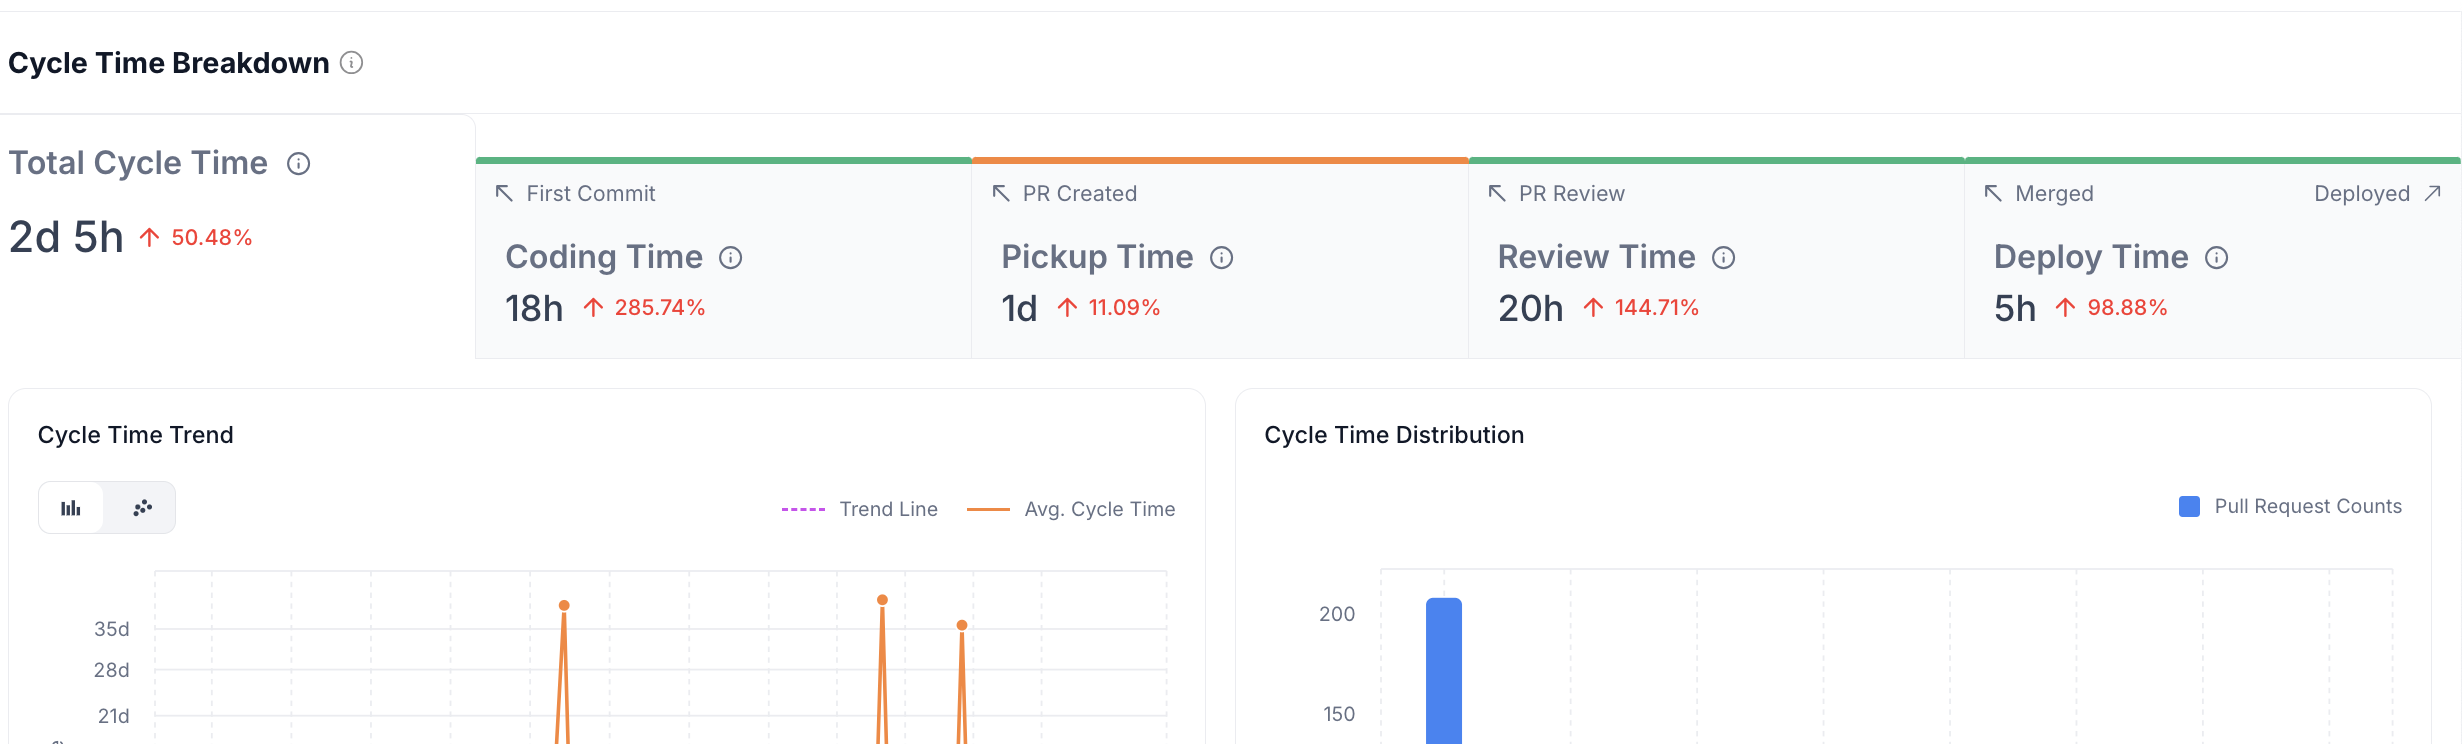
- Coding time: Average time spent from the first commit until the PR is ready for review. This includes the entire period a PR remains in the draft stage, with time in draft counted as part of the coding phase.
- Pickup time: Average time elapsed from when a PR is moved from draft to ready-for-review until the review process starts. The earliest recordable review action is a comment, approval, or request for changes.
- Review time: Average time elapsed by PRs in the review process after the first recordable review action. This includes all time spent iterating on the PR, making changes until it is merged.
- Deploy time: Average time elapsed from PR merge until deployment to production environment. The deployment data is sourced from deployment systems integrated with Hatica. Refer to the how to configure DORA dashboard document for more information.
This widget also provides a comparative trend vs. the last period, so if the data range is set to 30 days, say 1-Jun to 30-June, the comparison is versus the previous 30 days which is 2-May to 31-May.
Cycle Time Trend
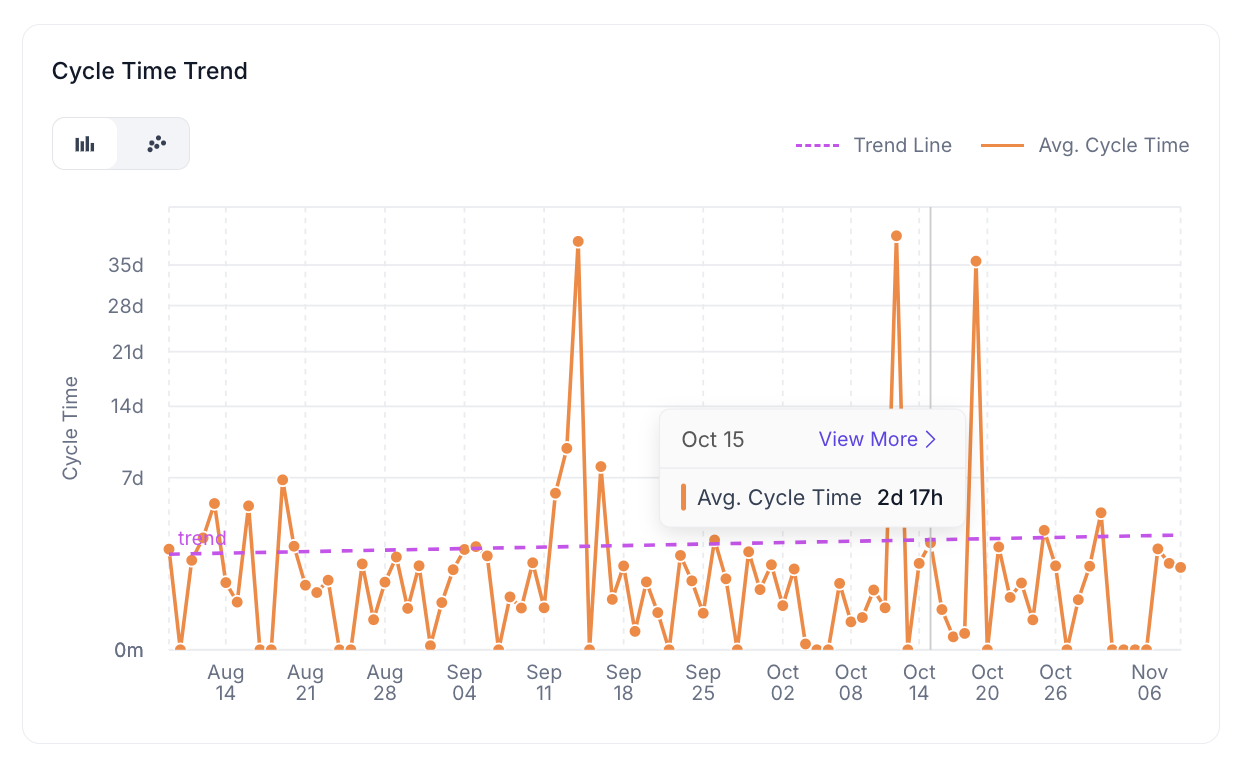
The Cycle Time Trend chart shows daily cycle times alongside a list of PRs contributing to the cycle time for each day. Click on a specific day to open a context menu displaying a full list of PRs with their cycle times.
The light blue trend line shows a linear regression, indicating cycle time trends. A downward slope suggests reduced cycle times over the specified date range, which is desirable. Use the cluster plot to view individual PR cycle times that meet the selected filter criteria.
Cycle Time Distribution
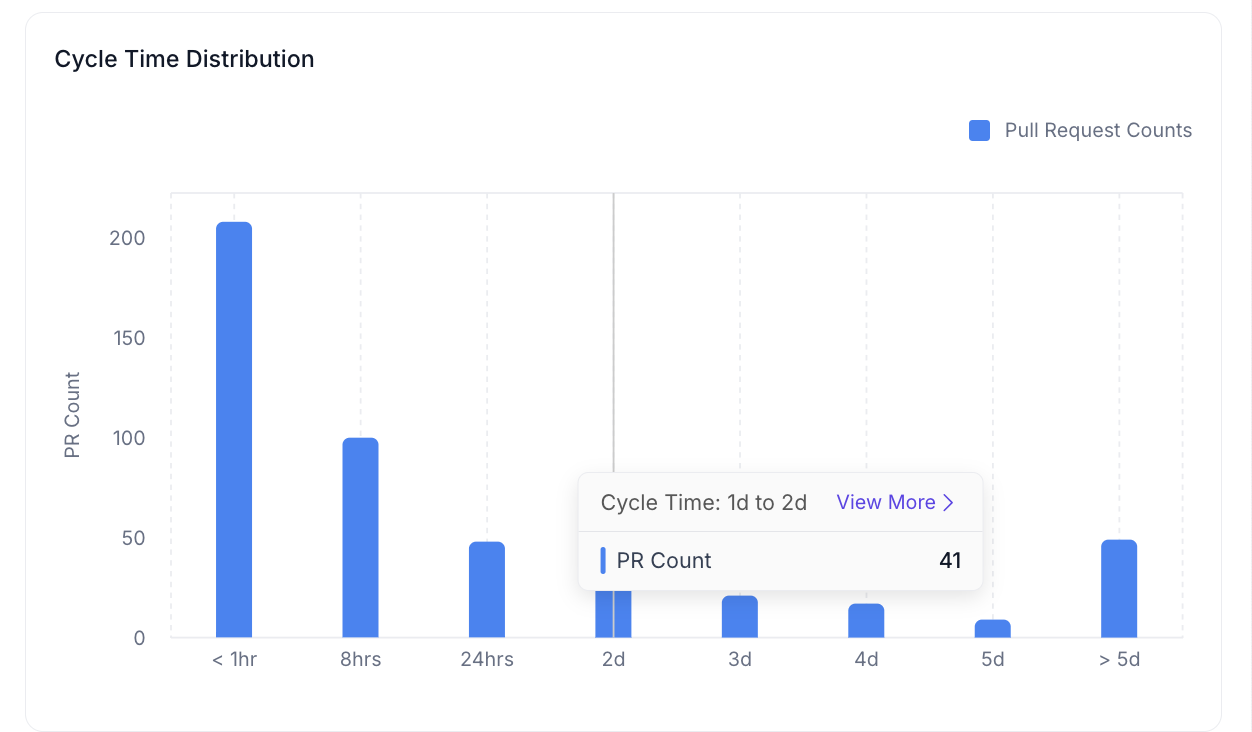
The Cycle Time Distribution histogram shows how cycle times are distributed across predefined time categories. This helps identify:
- Outliers with exceptionally high cycle times
- PRs falling into a "fat-middle" range, generally taking 2-4 days
- PRs with very low cycle times (eg. <1hr, <8hrs etc.)
This distribution allows teams to focus on patterns and PRs that contribute to a “shift-left” of the entire distribution.
Strategies to Reduce Cycle Time
- Start Small and Fast: Focus on creating smaller PRs to deliver value quickly and frequently.
- Automate Processes: Implement automated tools for continuous integration and releases, reducing manual efforts and improving speed.
- Breakdown Large PRs: Breaking work into smaller chunks enables quicker processing, reducing pickup and review times. The industry standard for PR size is around 300 lines of code (LOC).
Use Cases
The Team Velocity dashboard can help:
- Understand end-to-end cycle time across the organization
- Benchmark team performance against the organization-wide baseline
- Identify stages contributing to longer cycle times at the team or organizational level
- Identify repositories or teams lacking deployment data
Insights
Use this dashboard to gather insights on the following:
- Time spent in the coding phase
- Time PRs spend waiting for reviews
- Speed of the review process
- Deployment times for merged PRs
- Relative change in cycle time across development stages compared to the previous period
FAQs
We use GitFlow-branching, how do we compute cycle times for a specific release?
Use the Head branch to filter for all PRs merged to the development branch. As the branch name might vary across Repos it is important to provide the correct branch name in this filter
We use trunk-based development, how do we compute cycle times for a specific trunk?
Since the trunks are short-lived and merge to the master branch; the Base branch filter can be set to master to filter all PRs merged to the master branch
If the data is not filtered by Base or Head branch, what is the cycle time representing?
In this case, the Cycle time is computed for all PRs across all branches in Git, regardless of what is the base branch or the head branch.
My team relies on Local branches for development & does not merge these into Remote branches. How is the cycle time computed?
Cycle time is only computed for Remote Git branches; local branches are not included in computing cycle time.
How to compute Cycle time only for PRs that are merged and ignore PRs that are in other states?
Use the “Merged PRs only” filter to exclude PRs in other states
Why isn't the average total PR cycle time equal to the sum of the averages of Coding + Pickup + Review + Deploy times?
The average times for individual stages (Coding, Pickup, Review, Deploy) are calculated across all PRs that have reached that specific stage. The Average Total Cycle Time, however, only considers PRs that have gone through the entire process from start to finish. Since you always have PRs at various stages of completion, simply adding the individual average times won't accurately represent the average time for a PR to complete its full lifecycle. They are measuring different sets of PRs. Following this, you will see that coding time will be averaged for all PRs that are open, merged and deployed. Pickup time will be averaged for all PRs that are still in-review, merged or deployed. Review time will be averaged for all PRs that have been picked up for review, merged, or deployed. Deploy time will be averaged for all deployed PRs.
How is cycle time computed for PRs that have not been deployed?
Cycle time for undeployed PRs is the elapsed time until the last update for example:
- if the PR has been merged then cycle time is the cumulative time from first Commit until merge.
- if the PR is currently in the review phase then cycle time is the cumulative time from first Commit until now & will keep increasing until the current phase is completed.
How are draft PRs handled?
Draft PRs are incorporated into Hatica's Cycle Time metrics. Specifically, time spent in the draft stage is considered as Coding Time, while Pickup Time begins only once the PR transitions from draft to ready-for-review. Draft PRs also appear as a separate PR Status in PR Tables across the platform, enabling complete and consistent tracking of these PRs within Hatica's metrics.
How is rebasing/squashing handled?
Currently rebasing and squashing aren't accounted for; support for these is coming soon.
Is deployment data affected when deploy action is set as **push to branch** and the branch is excluded in the workflow exclusion
If a PR is merged into a branch which is excluded then the PR won't be visible in Hatica due to exclusion but the deployments data will not be affected.
Is the viewed checkbox in bitbucket considered for review time?
No, the viewed checkbox is not considered for review time.
Why is the LOC changes different in Hatica and Github?
We purposefully exclude a lot of files from loc counts things like binary files, package.json etc. The following types of files are excluded:
- Test files: Files with names ending in .test or .spec, with extensions .tsx, .ts, .js, or .jsx.
- Mock files: Files with names ending in .model, .mock, or .mocks with extensions .ts or .js.
- Dependency lock file: The yarn.lock file, which tracks dependencies rather than code changes.
Further reading
- Here are a few ways to improve your dev velocity based on the dev cycle time metrics: https://www.hatica.io/blog/cycle-time-to-improve-dev-velocity/(opens in a new tab) (opens in a new tab)
- Get an overview understanding of the dev cycle time and how it can help your teams: https://www.hatica.io/blog/cycle-time/(opens in a new tab) (opens in a new tab)
- Trunk-based Development vs. Git Flow https://www.toptal.com/software/trunk-based-development-git-flow (opens in a new tab)