Cycle time metrics
Understand your engineering team's velocity and identify bottlenecks in the software development life cycle (SDLC)
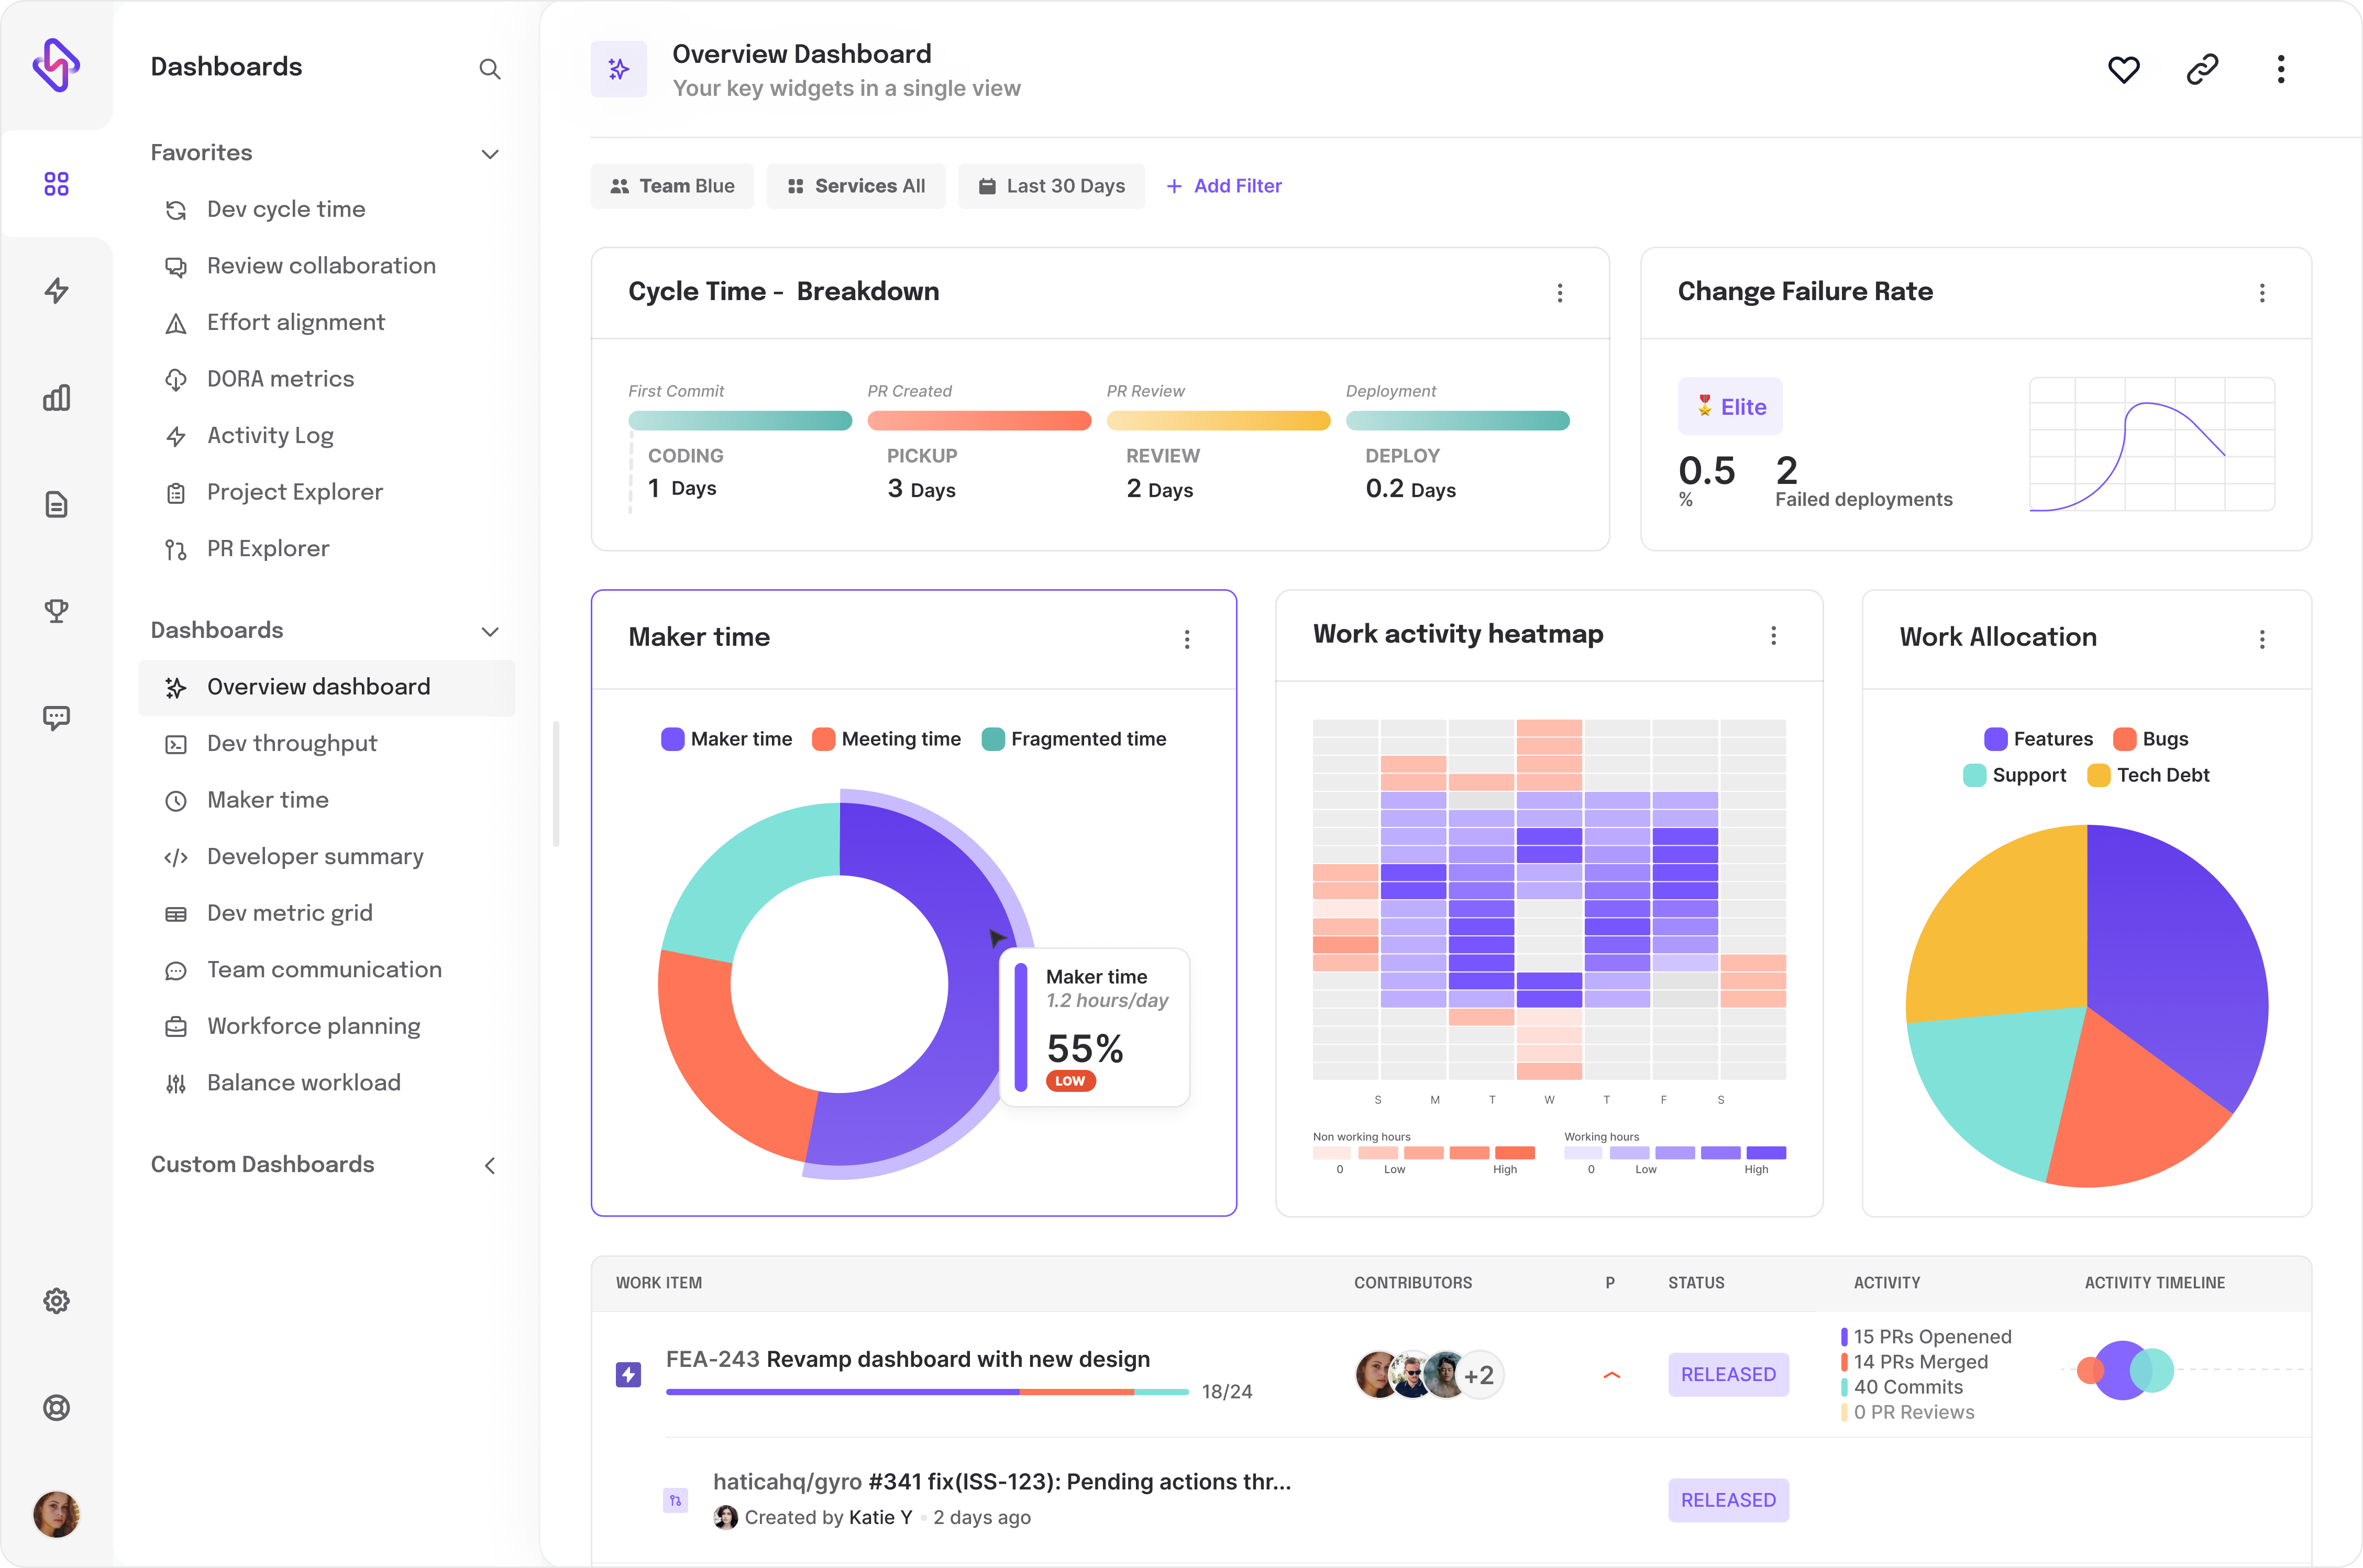
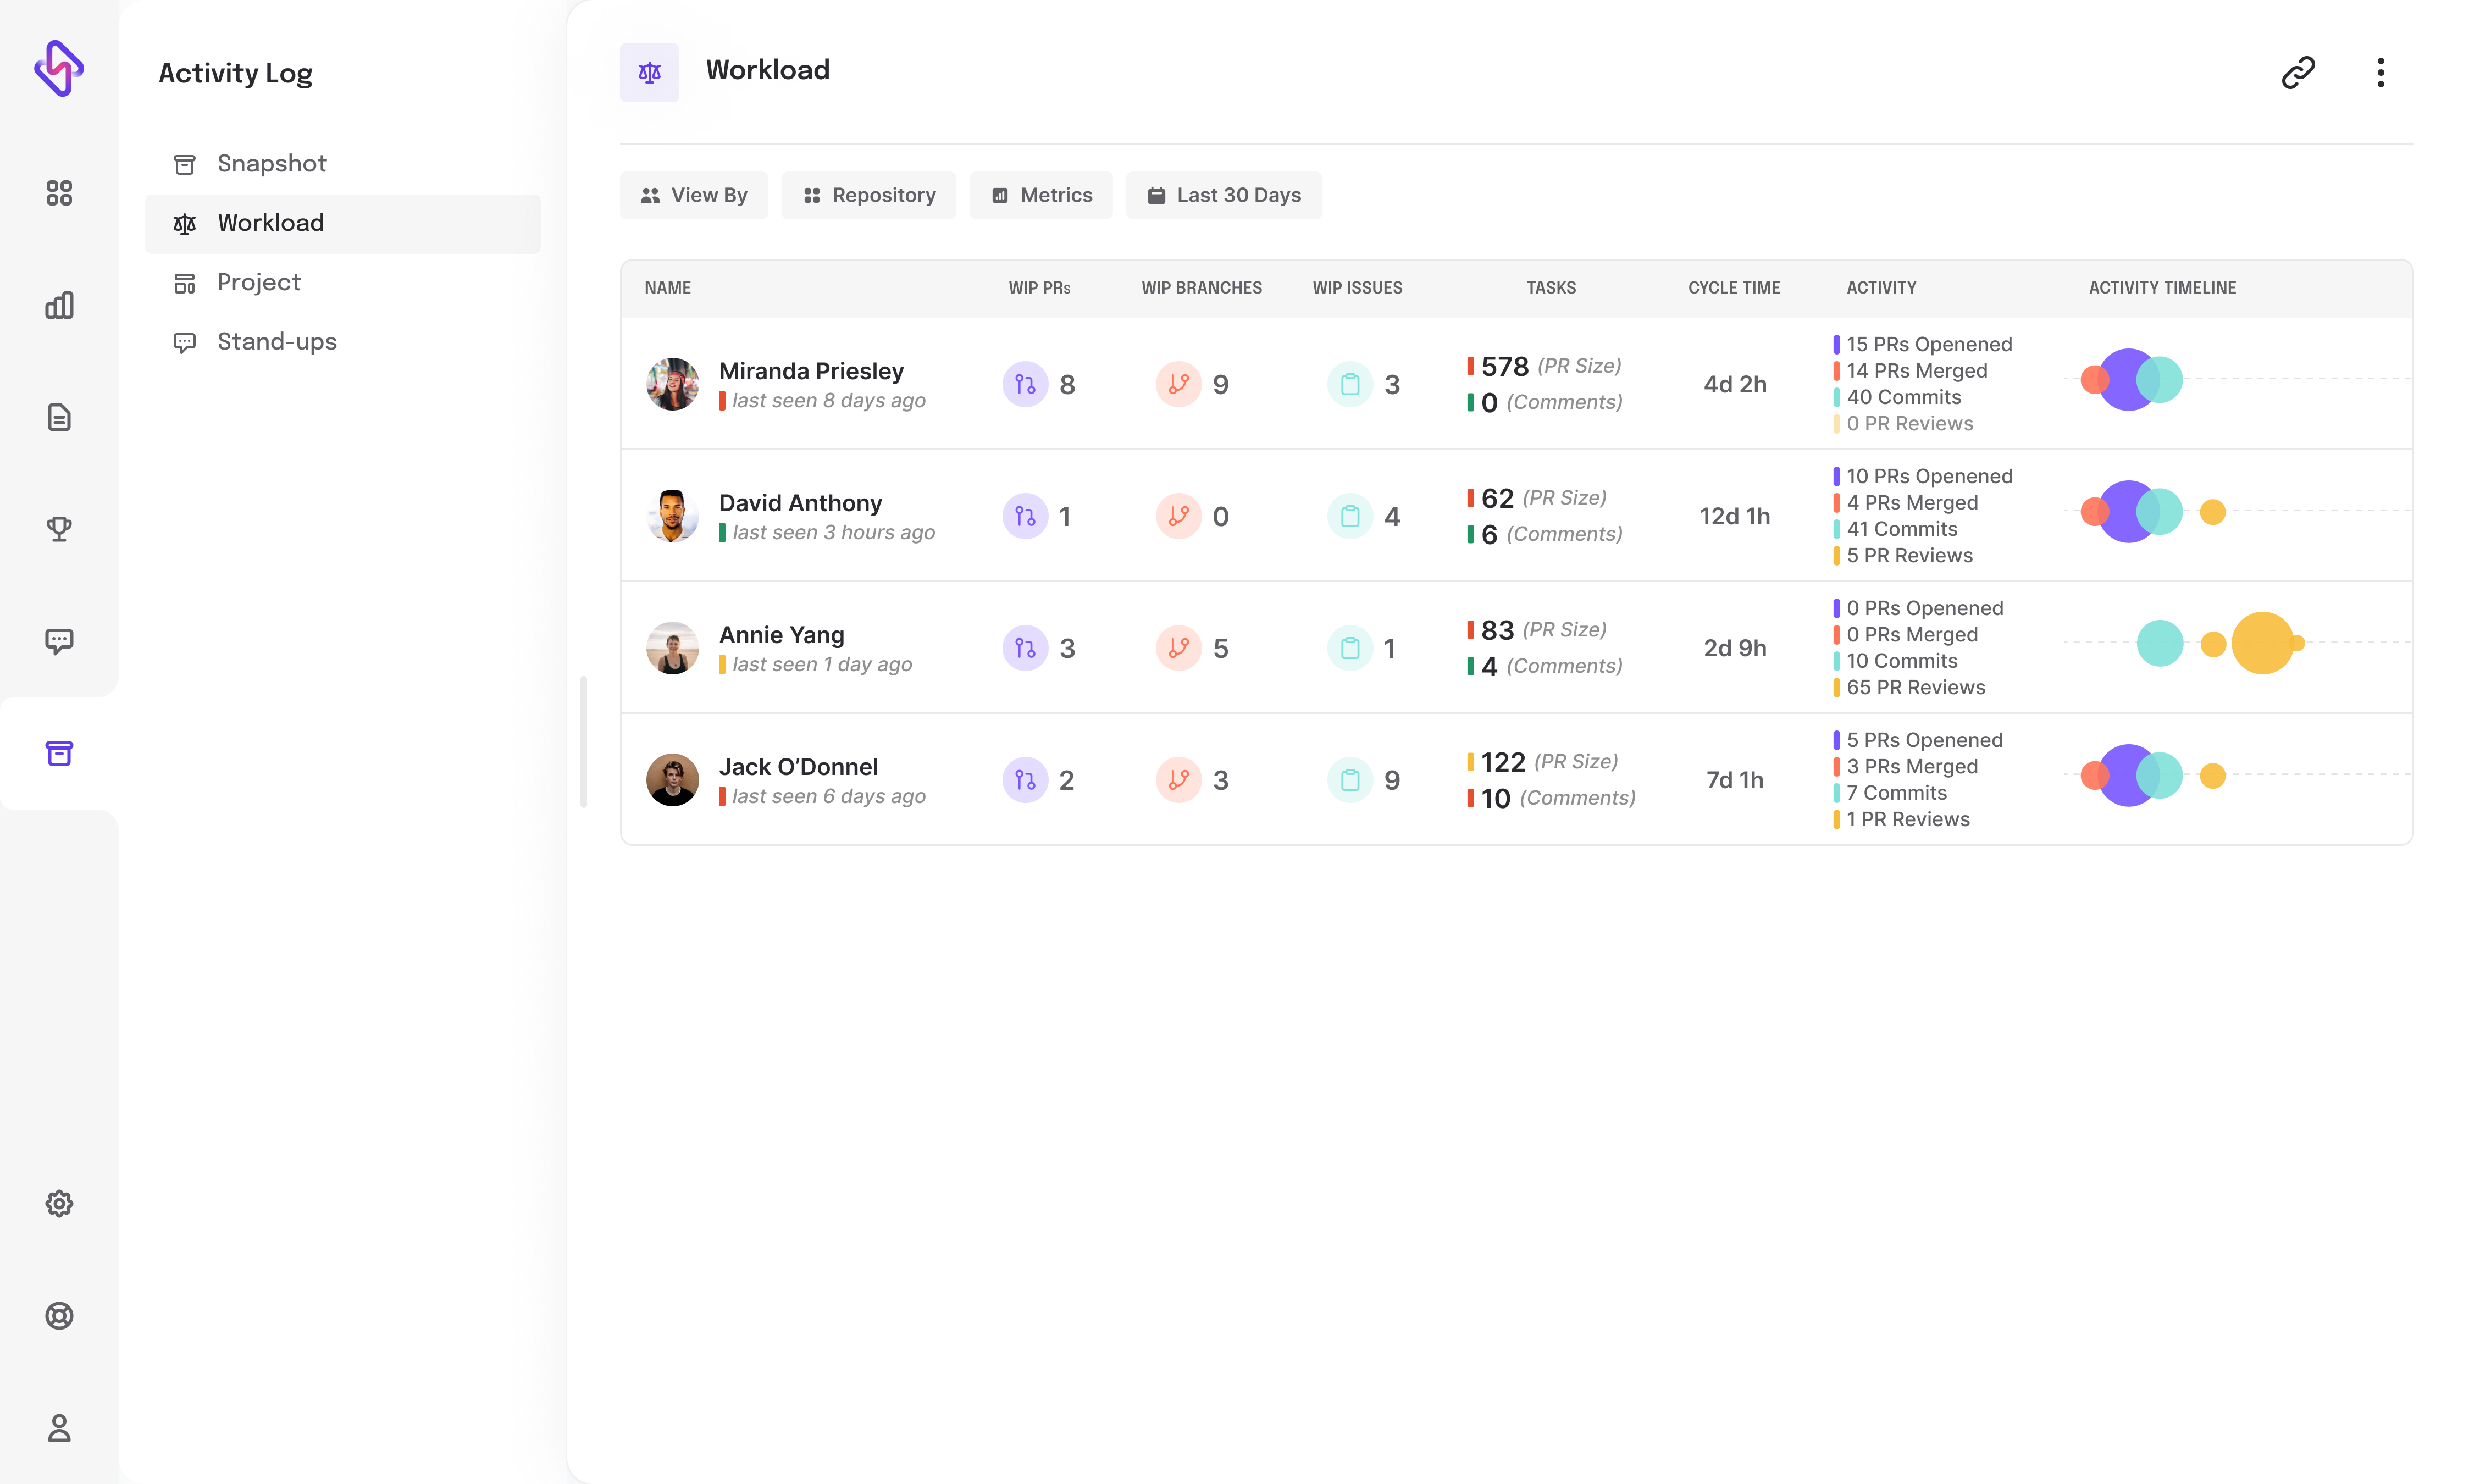
Map out the developer workflow
Hatica integrates with your Git and project management tools to automatically map out your team's workflow, from picking up a coding task to deployment, to help you track end-to-end cycle time.Understand your team's delivery flow and velocity and identify bottlenecks in the various steps of the development process.
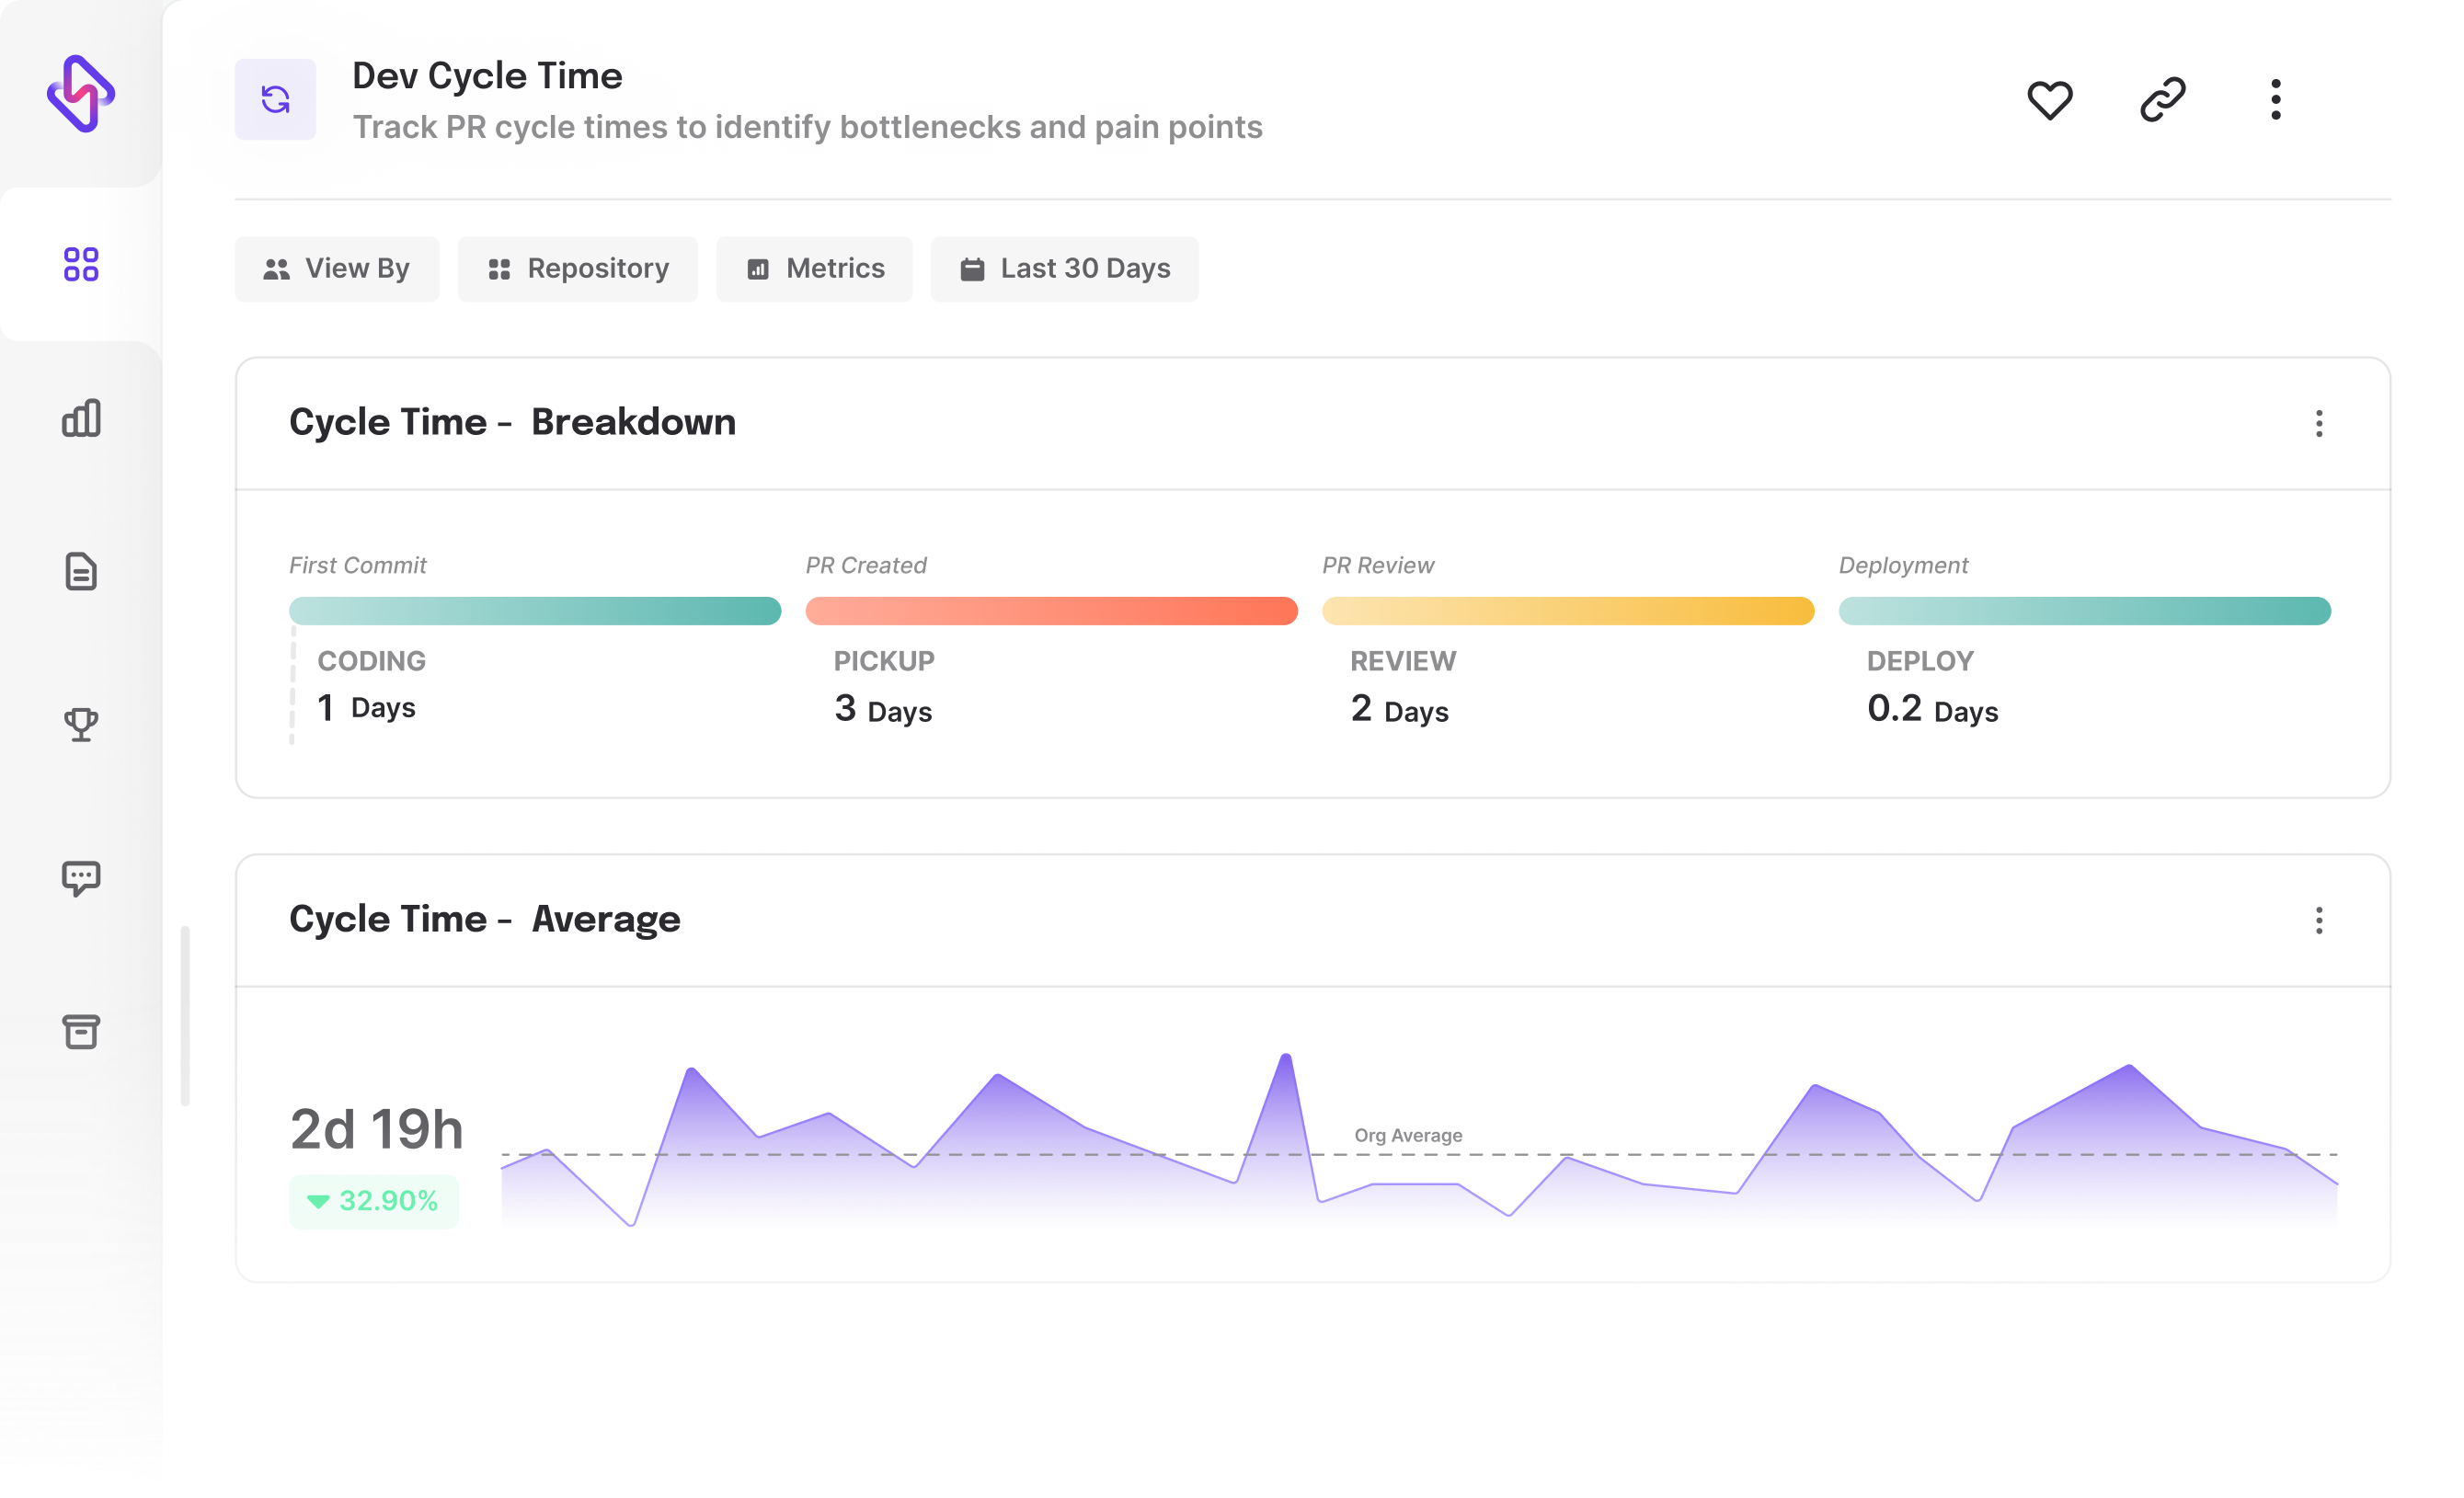
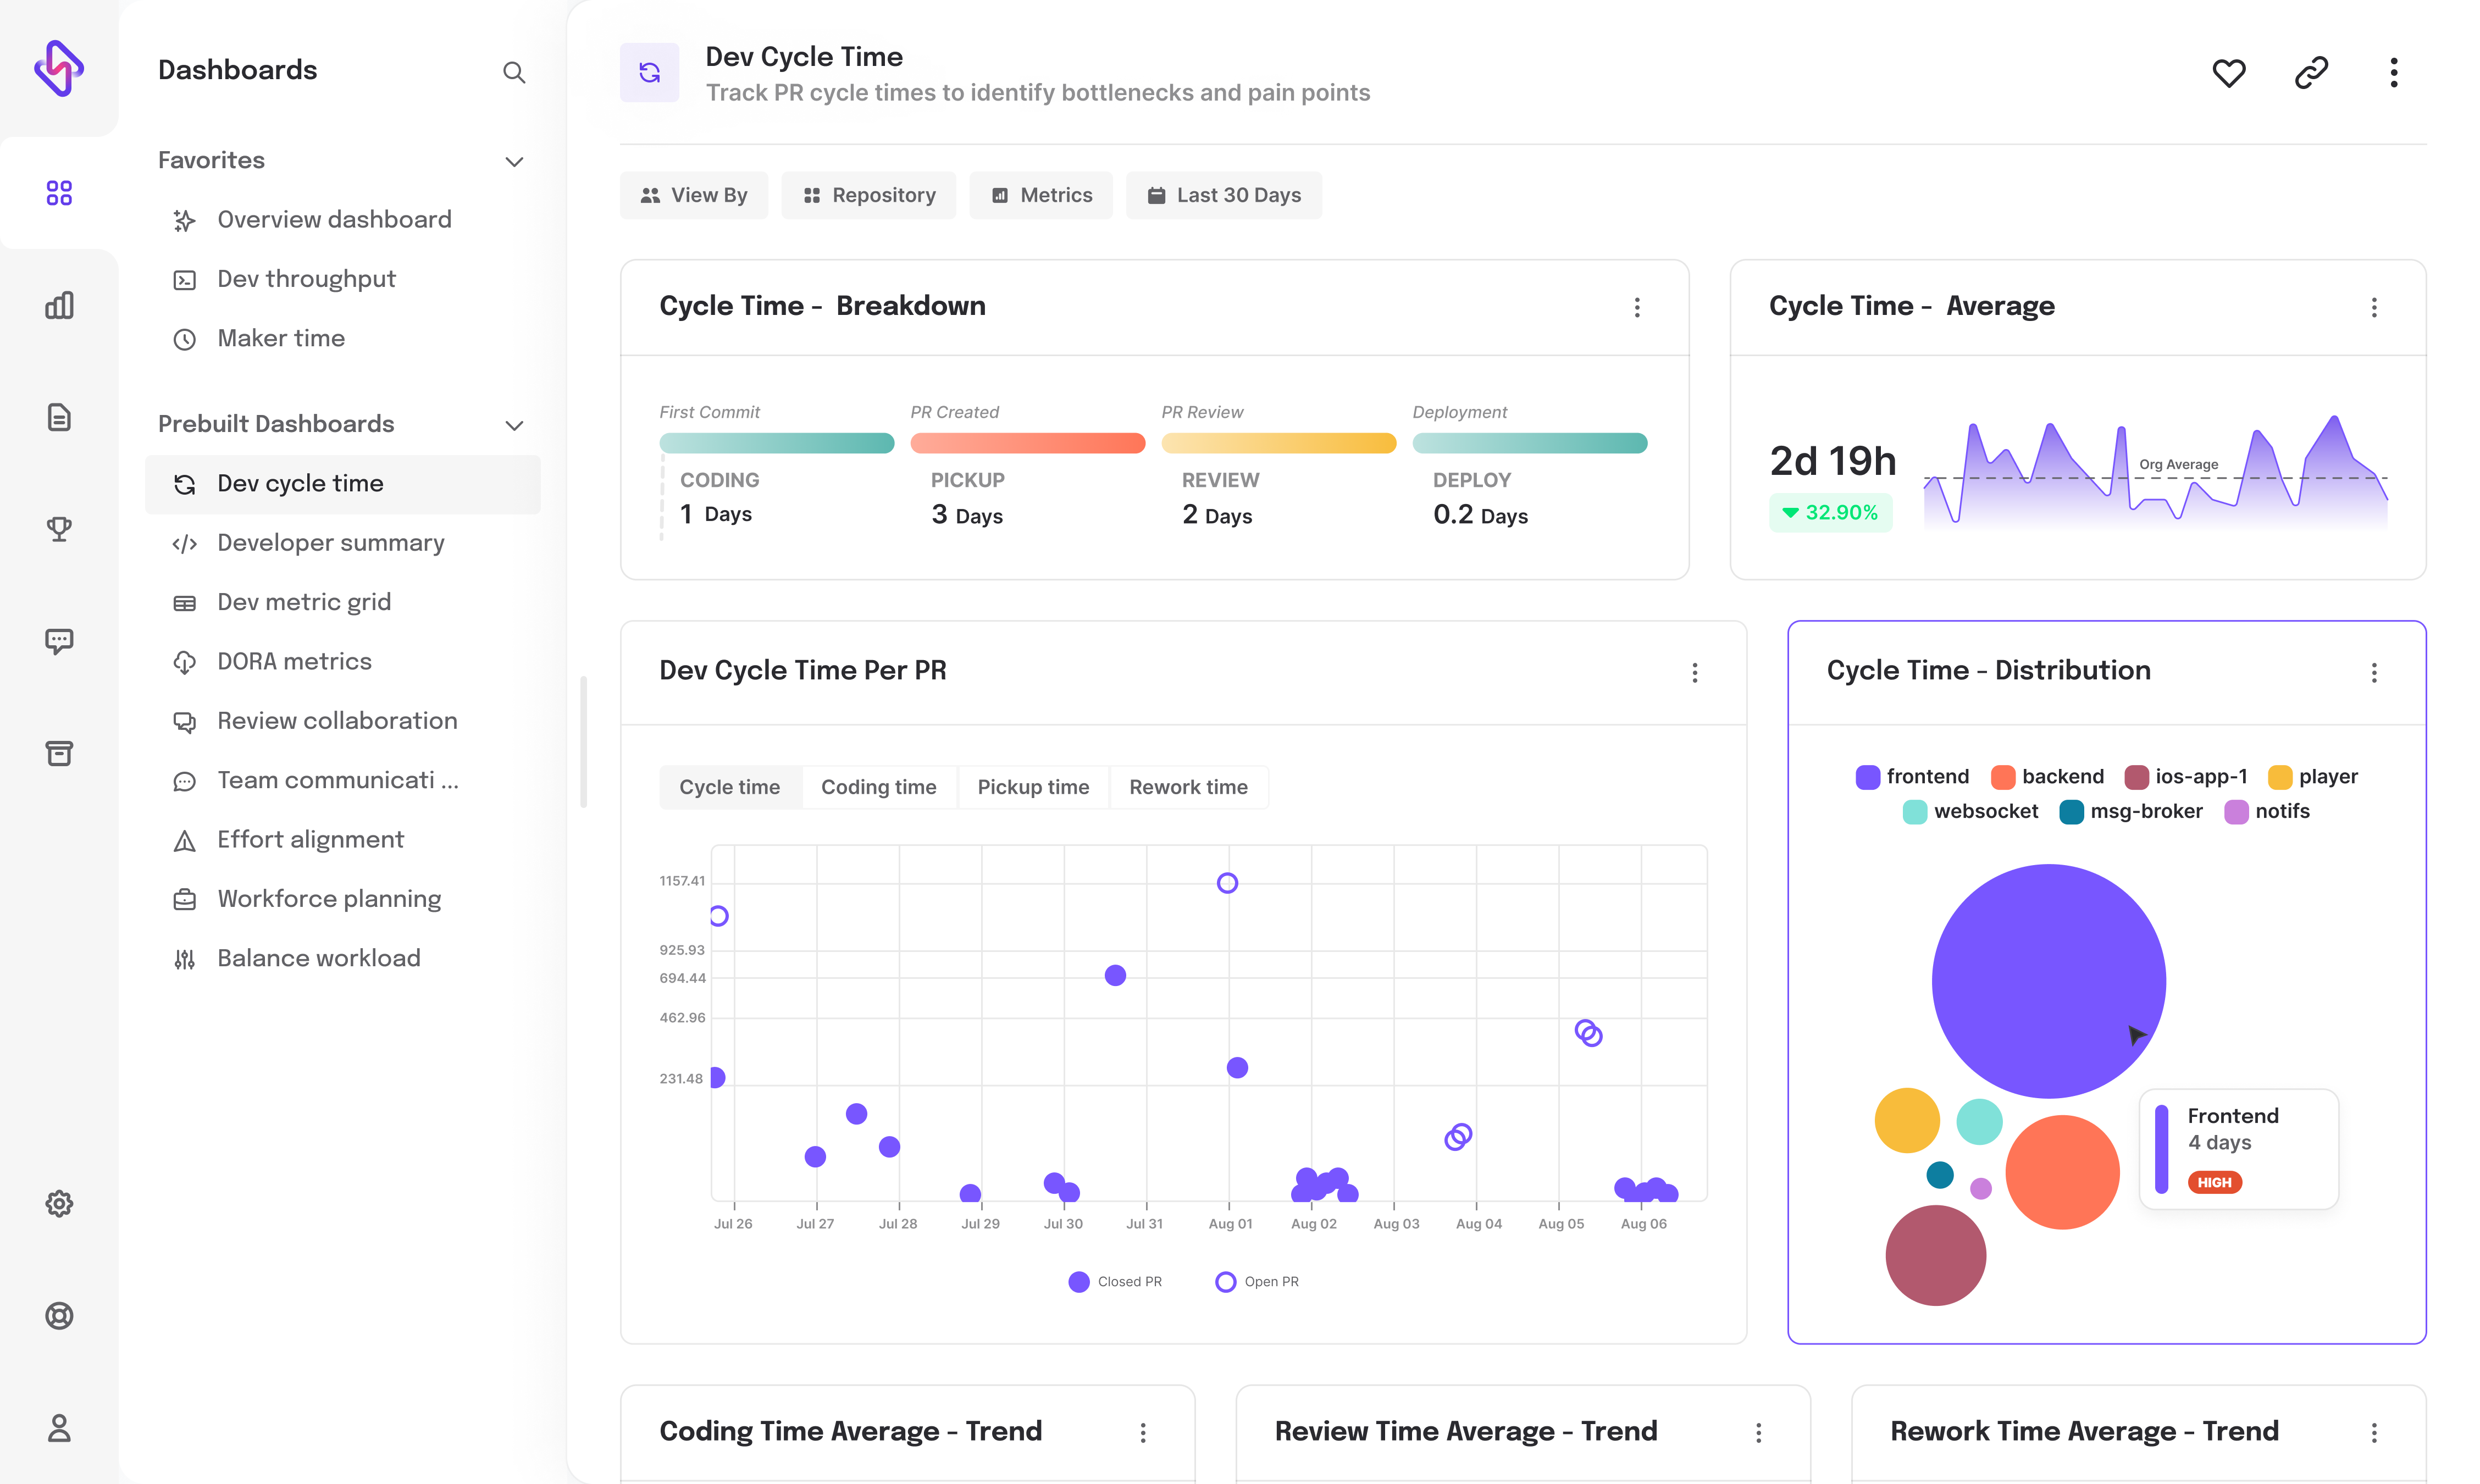
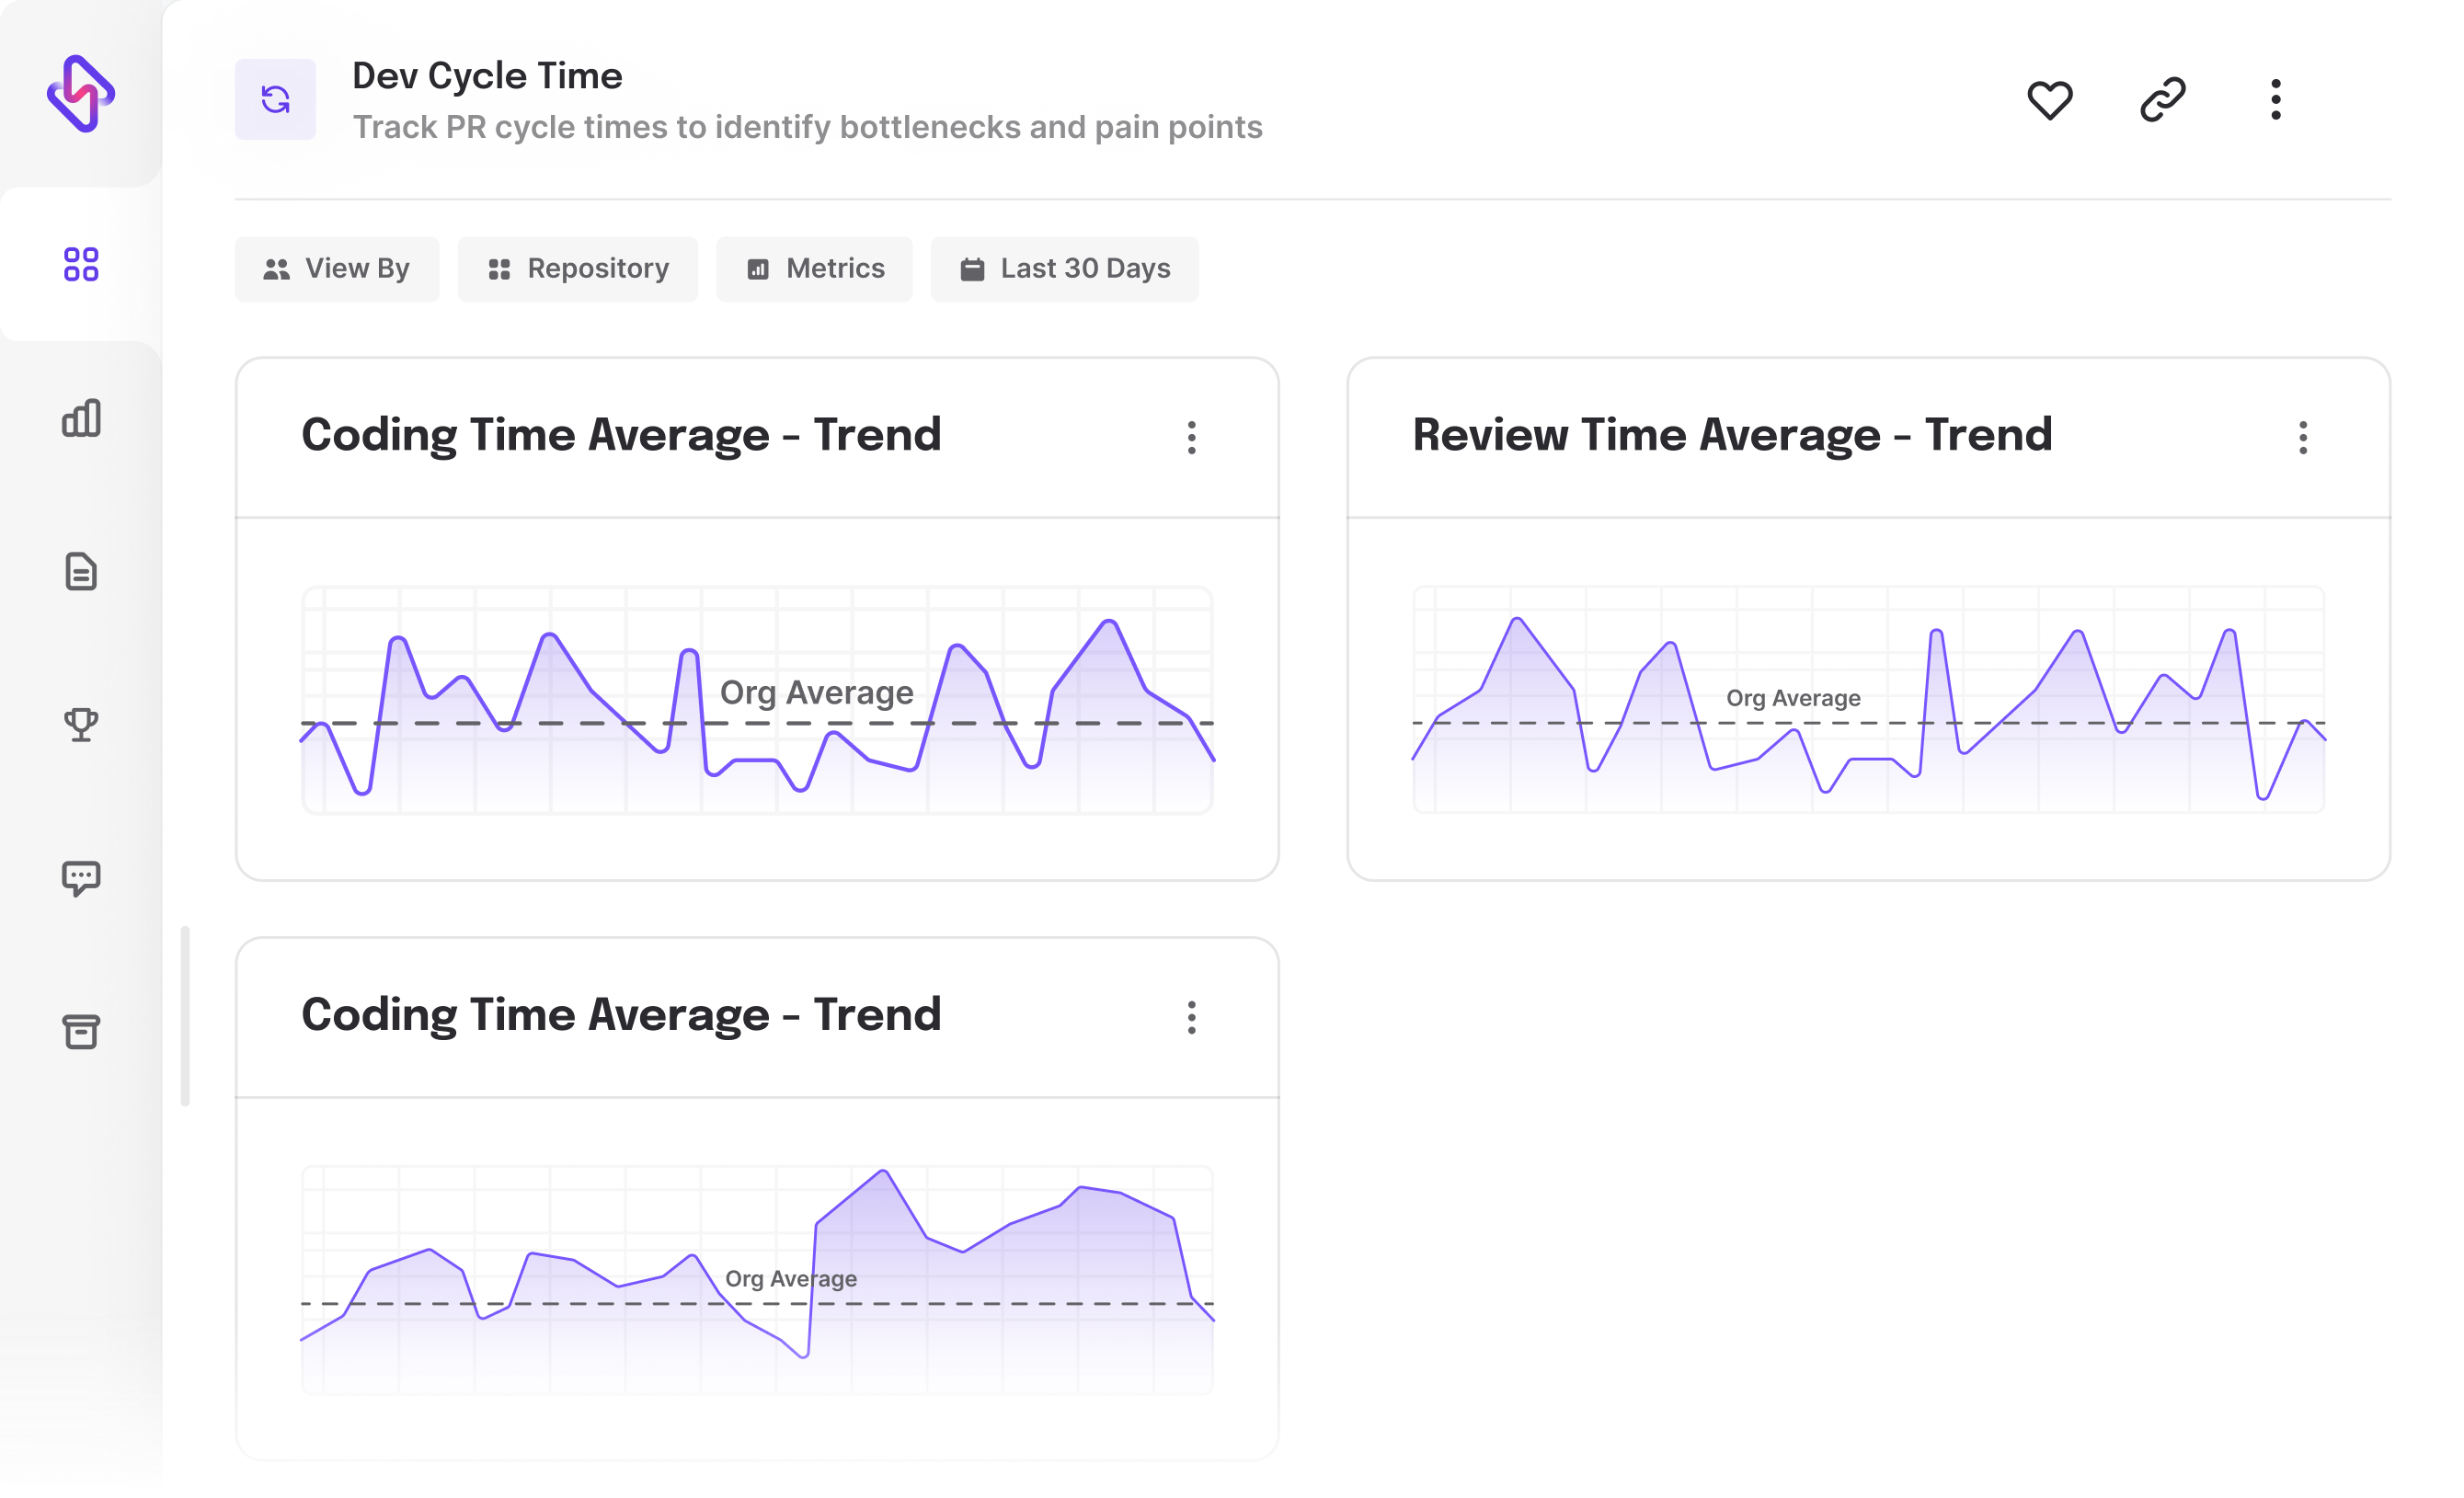
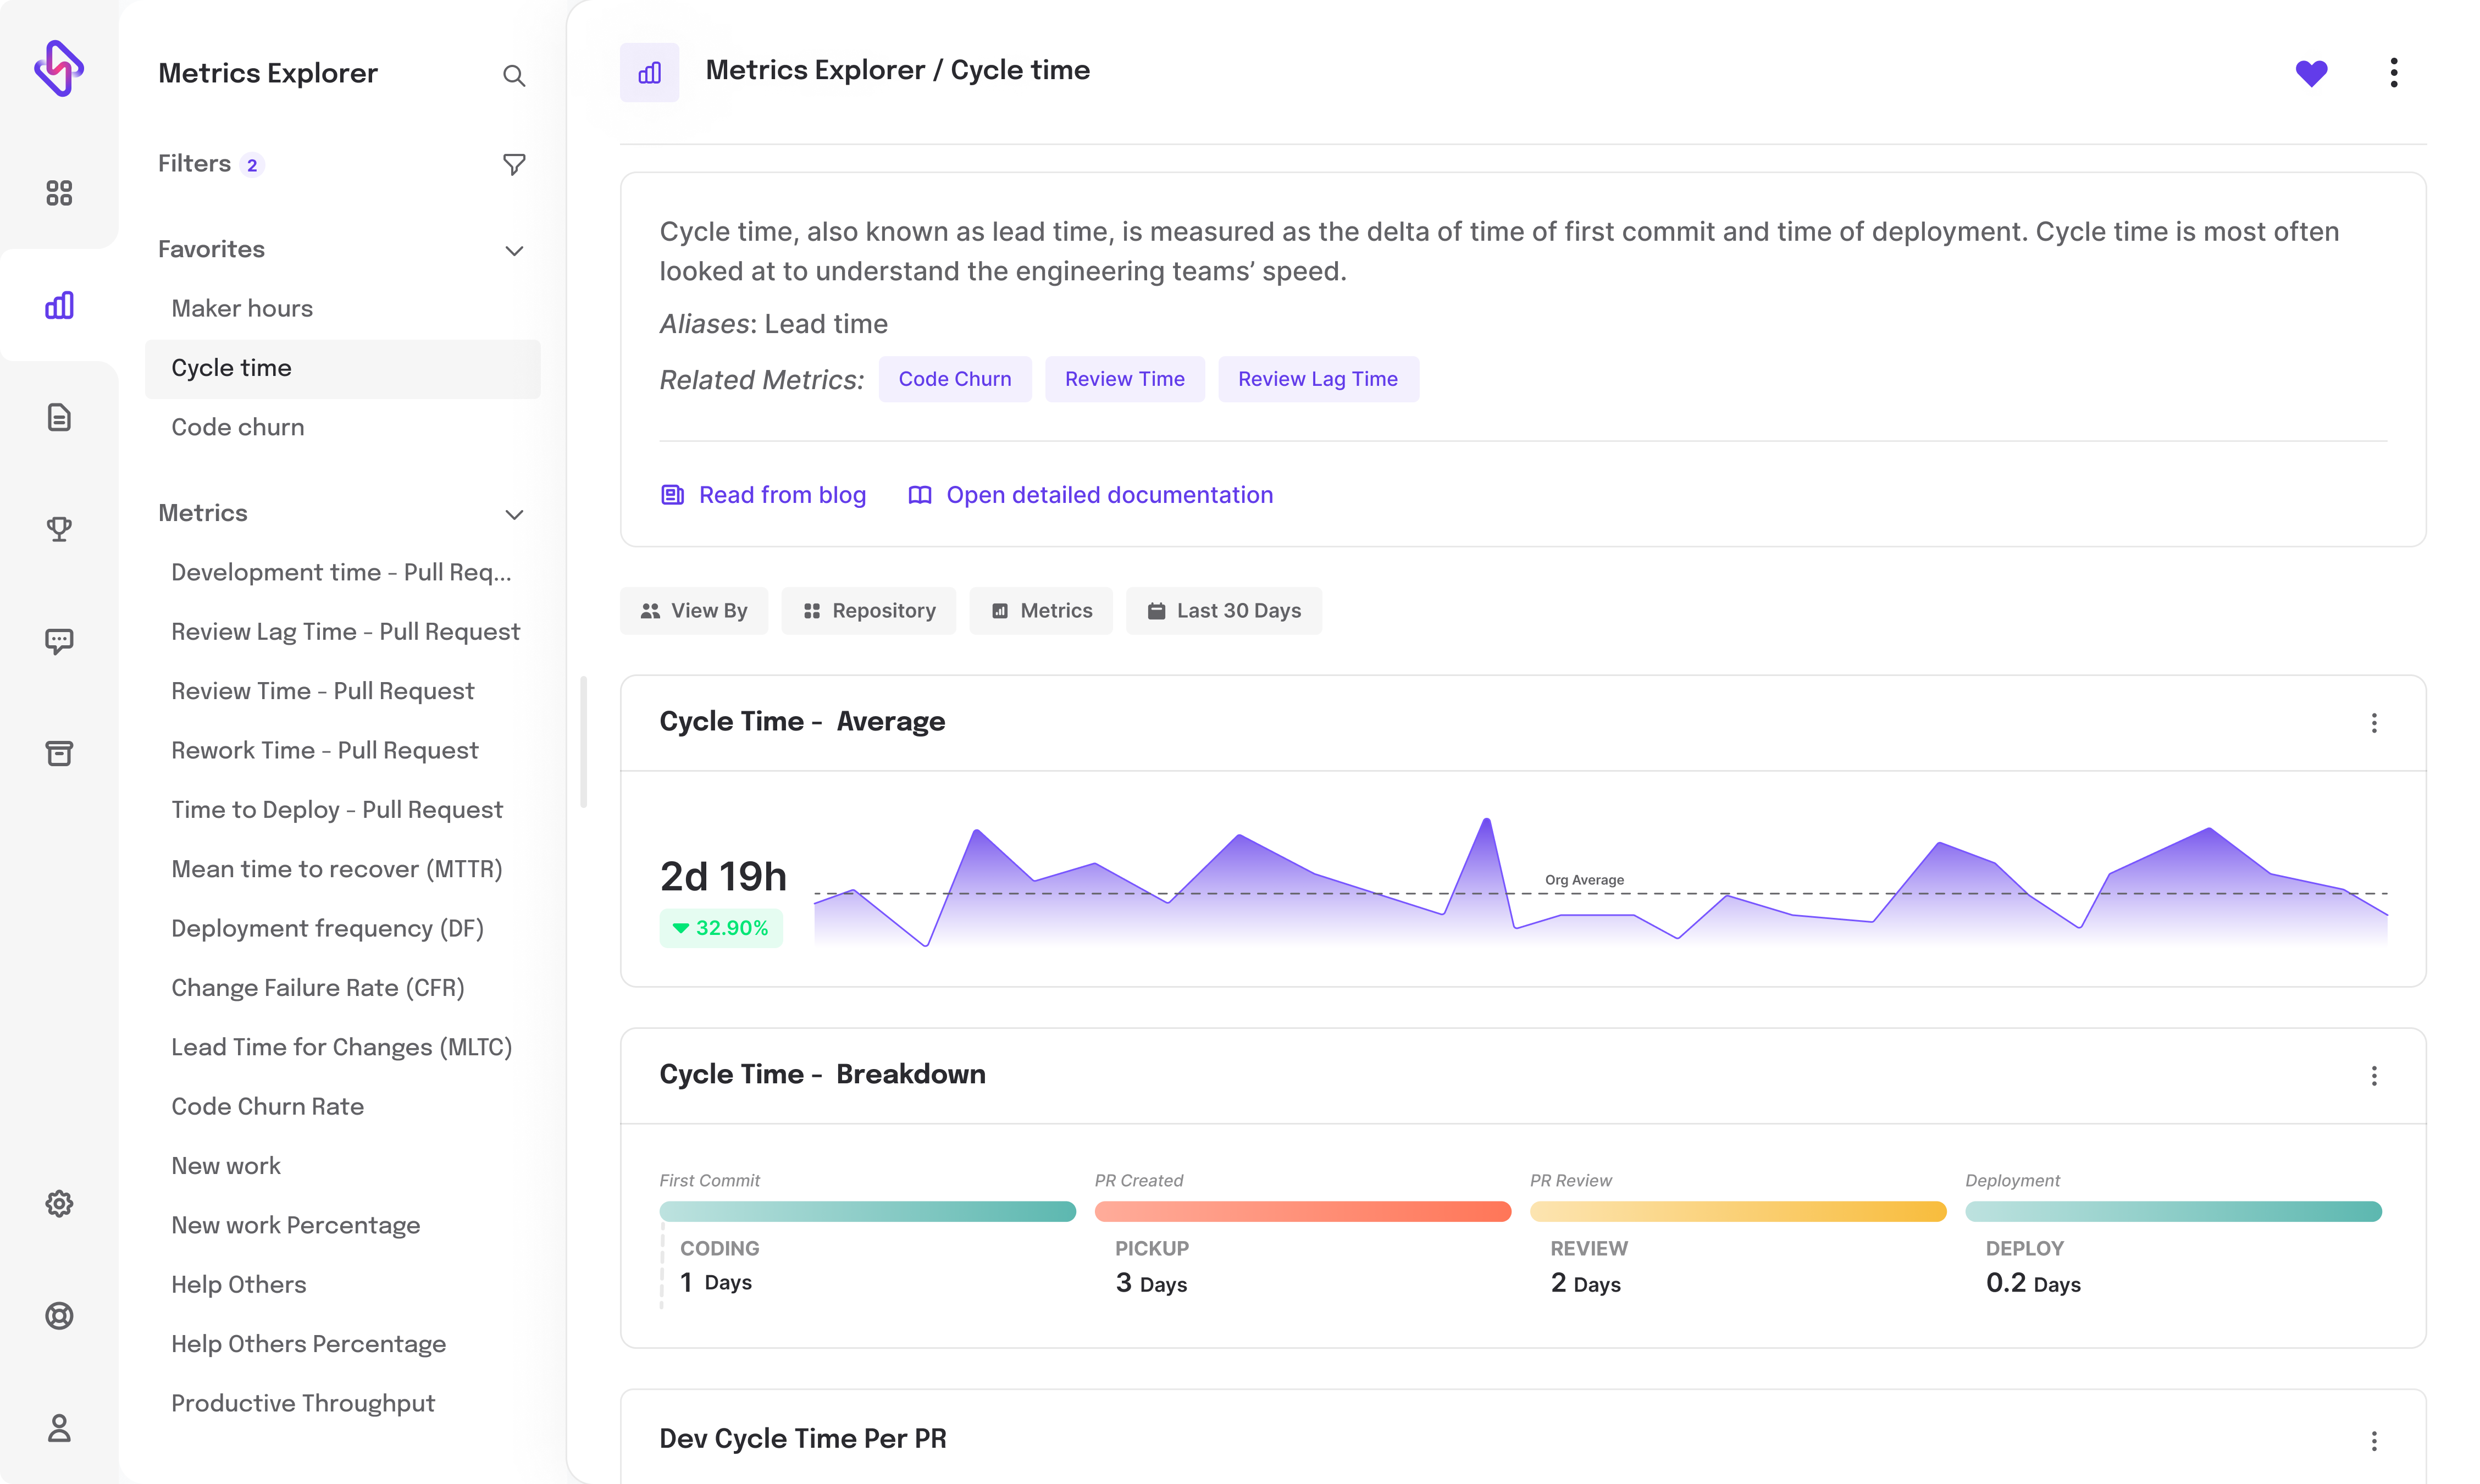
Cycle time breakdown
Dig deeper into each step of the process by tracking trends for
- Coding time
- Review time
- Rework time
- Deployment time
Track cycle time across different dimensions
- For Repos, Pull requests and Branches


- For Projects and Issues


- Across teams and timezones
Comprehensive work visibility
so you can base your decisions on the whole picture
Complement cycle time with 70+ software engineering metrics to get the full picture of developer productivity and well-being to help your teams achieve excellence.
- Review involvement
- Active Coding days
- Effort allocation metrics
- Code quality metrics
- DORA metrics
- Maker hours and meeting hours and more
Ready to dive in? Start your free trial today