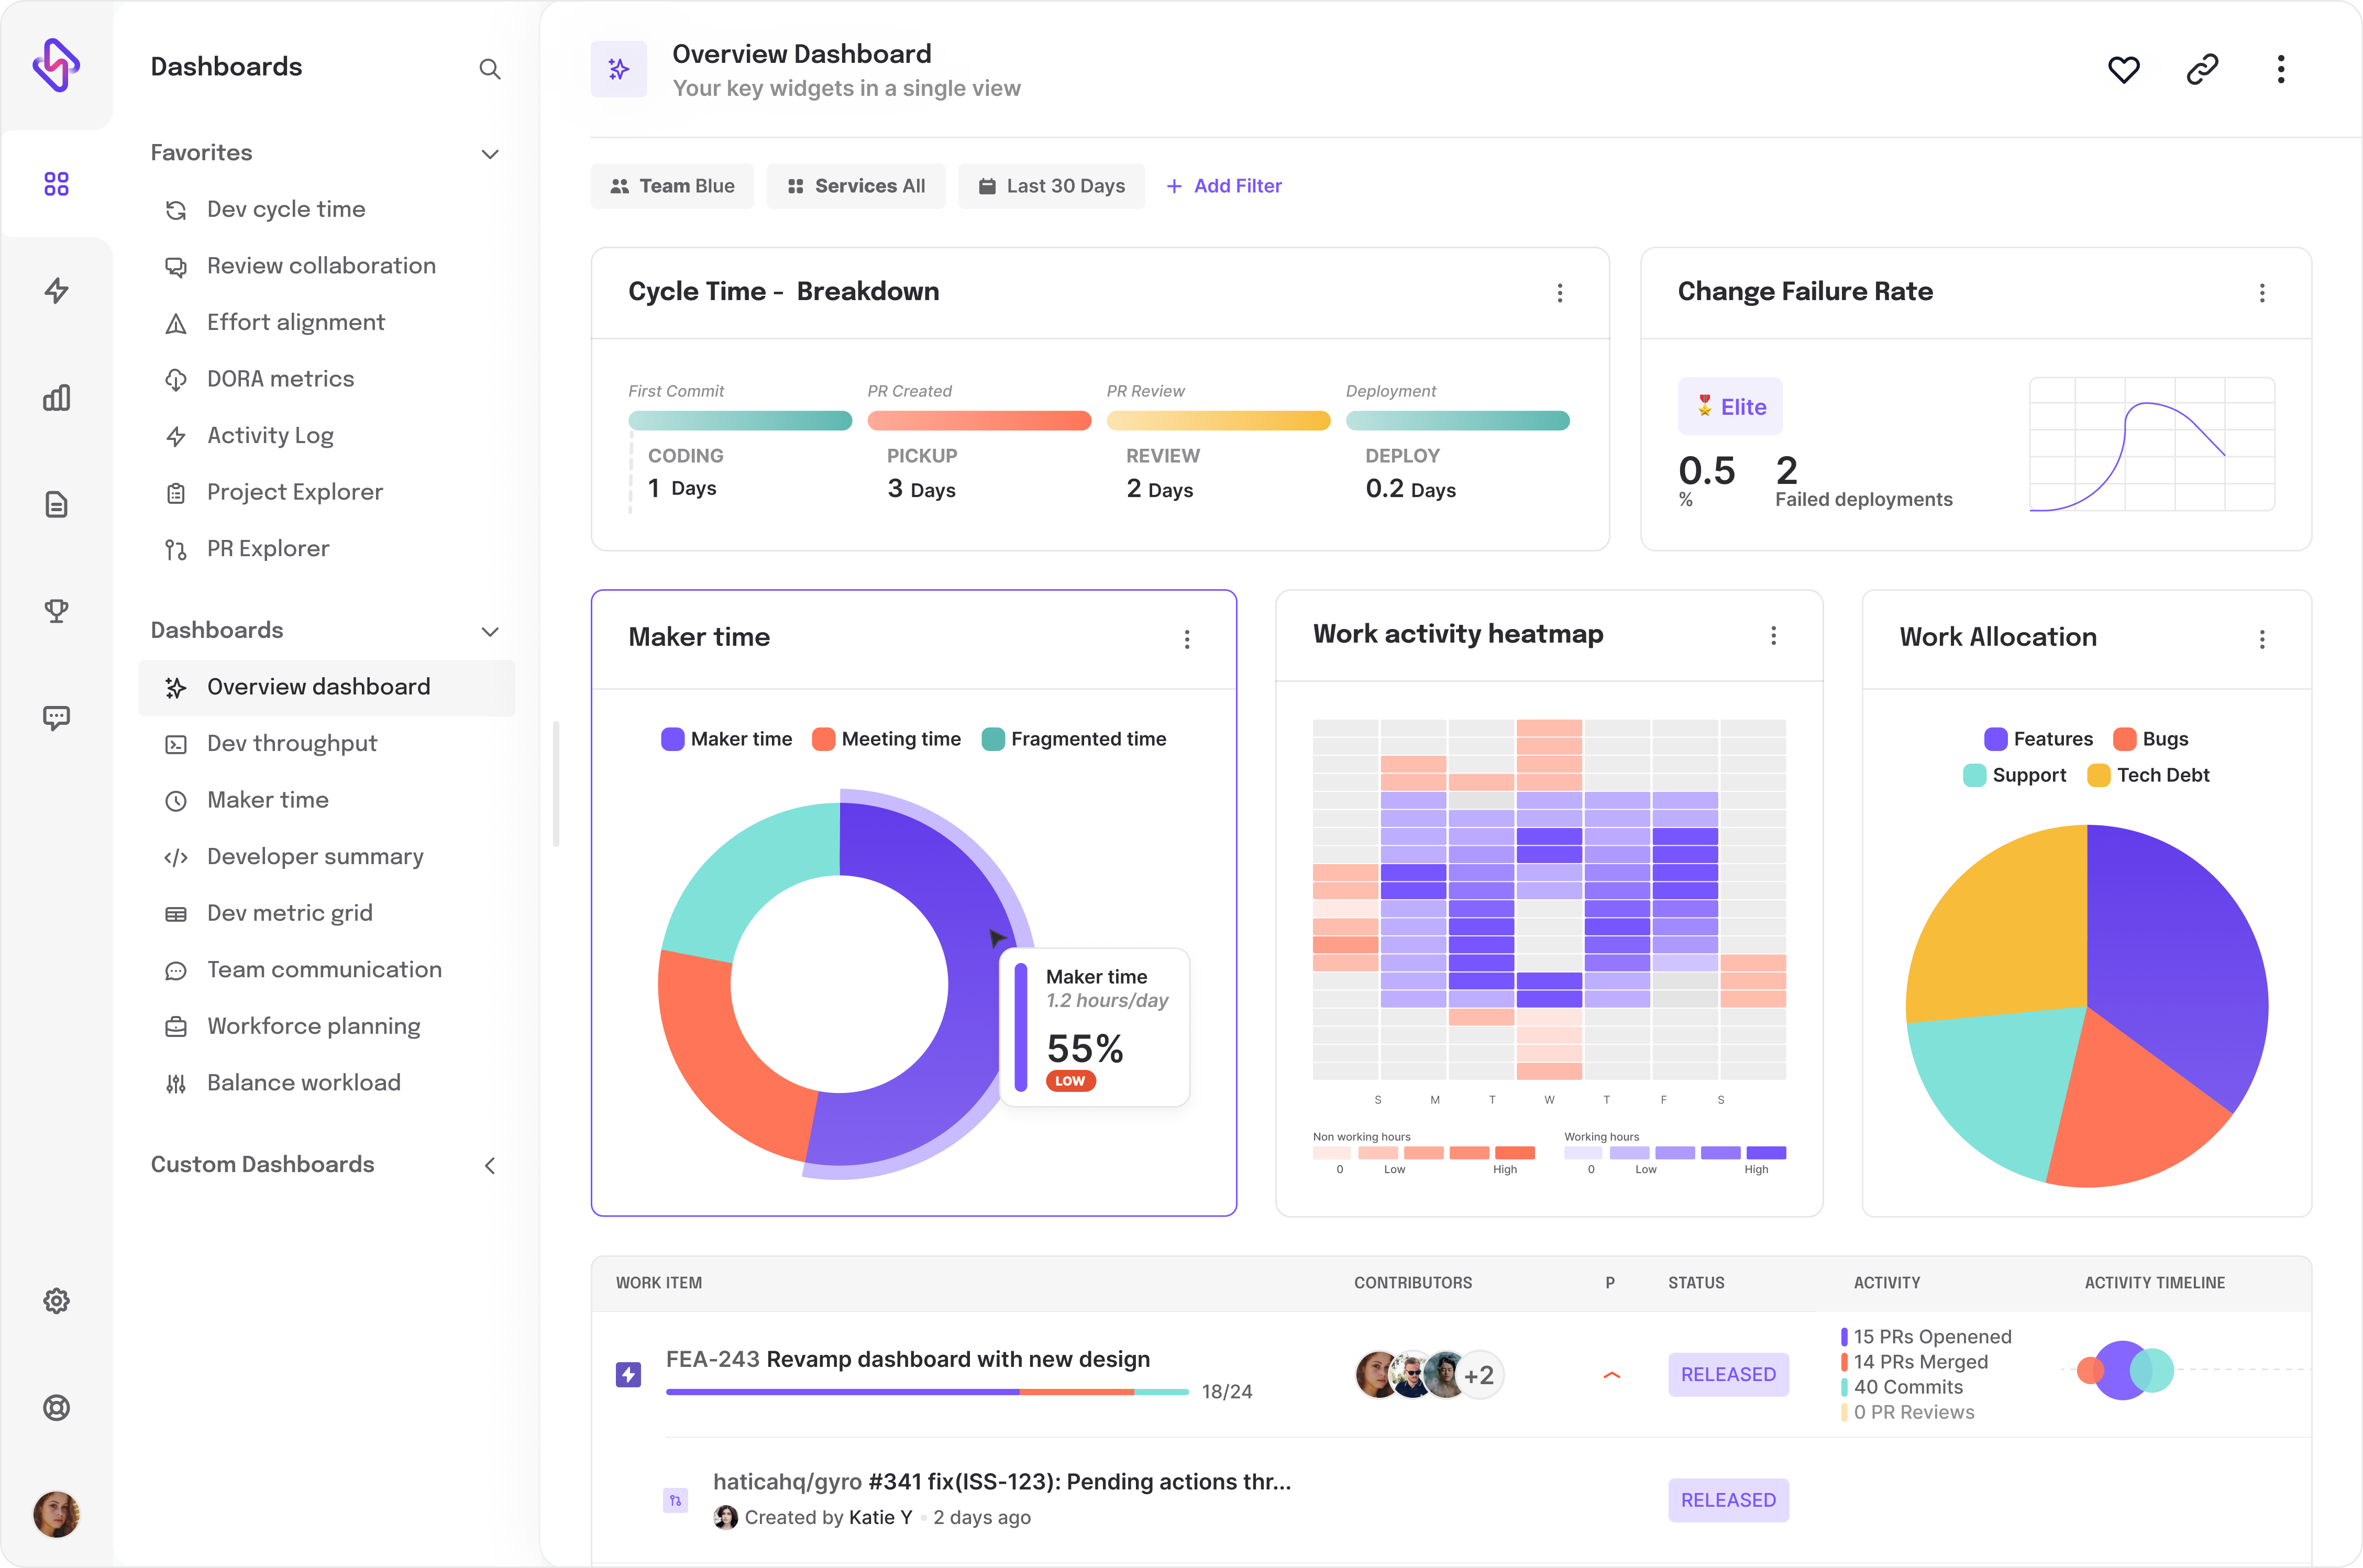
Software Engineering Team Metrics
Know more about the various engineering metrics that Engineering Managers, Directors, VPs of Engineering, and CTOs use to improve their team's productivity and well being.
Git Graph Vs GitLens
Git Graph or GitLens? One visualizes branches; the other decodes your repo's history. Discover the perfect tool for your Git workflow!
Story Points Vs Hours
Story Points focus on task complexity, while Hours track time. Together, these agile metrics help teams improve project alignment, planning, and performance.
Burn Up Vs Burndown Chart
Burn-up and burndown charts are essential tools in project management for tracking progress and managing workload.
Git Graph Vs Git History
Learn Git Graph vs Git History: Git Graph simplifies branch and commit tracking, while Git History dives into detailed file changes and diff views.
GitHub Tag Vs Release
Learn the key differences between GitHub tags and releases for version control, from marking milestones to distributing software with notes and binaries.
Productive throughput and efficiency
This section gives critical metrics on code quality, and the overall productivity of the work being committed - code churn, productive throughput, and efficiency metrics.
Coding Days
A Coding day is any day when an engineer commits code.
PR Size
This metric gives the average size of the PR (or LoC changes).
Lines of Code
This metric counts the total lines of code contributed.
Planning accuracy
This represents the distribution of tasks/issues completed that were planned vs unplanned.
Code Churn
Code that is edited within 21 days of its first merge is called Code churn. Read more about what it is, and what it means to your engineering teams.
Cycle Time
Streamline your software engineering with Cycle Time Metrics insights from Hatica. Identify bottlenecks and improve your development cycle.
Promised vs delivered
Track sprint performance: Compare promised vs. delivered efforts, issues, or story points. Identify planning issues for improved efficiency.
Effort type
See the distribution of effort (based on issues/ story points as per selection) based on the type of issue including bugs, incidents, and stories.
DORA Metrics
Unlock success with DORA Metrics: Measure deployment frequency, change failure rate, cycle time, and MTTR for elite software performance.
Unreviewed PRs merged
When PRs are merged without a review, it gets counted under this metric. Unreviewed PRs can be detrimental. Read all about this metric here.
Incident priority breakdown
The count (story points or number of issues/tasks based on selection) of Incidents resolved and their breakdown by priority is presented in this metric.
Maker Time
This metric shows the average number of hours of maker time (focus time that is spent on work without distractions like meetings, etc) by the user or the team.
Ready to dive in? Start your free trial today

